December 15, 2019
If you think finding, downloading, and analyzing satellite data is confusing, you’re not alone. The different satellites, sensors, and websites to retrieve data are overwhelming and I think somewhat user prohibiting. A quick Google search might lead to what you’re looking for, but can also lead to more confusion and questions. Therefore, I would like to devote this blog to explaining how to access the appropriate type of ocean color satellite imagery.
Before searching for satellite imagery, there are a few questions you should think about:
- What are trying to get satellite imagery of?
- Do you want global coverage? Or are you studying a particular estuary or lake? The spatial resolution (i.e. the size of the pixels) can be important. See my first remote sensing blog post about the importance of spatial resolution.
- How much time do you have?
- Do you want to get quick image in an hour or less? Or do you want to bulk download imagery for multiple dates? If you’re only worried about visualizing imagery, downloading big files might not be necessary.
- What kind of satellite data do you want?
- Do you simply want to obtain a PNG of a satellite image for a presentation? Or do you want to download a matrix of values as a netCDF file? Or maybe you want to download a GeoTIFF to pull into GIS? There are some websites solely for downloading, some that are user-friendly for visualizing, and some software that has advanced capabilities for analyzing and manipulating.
- Do you care about satellite processing parameters?
- Will the standard satellite processing parameters (e.g. atmospheric correction, bio-optical algorithms) be appropriate for your work? Or do you want to process the imagery on your own? This will determine the level of satellite imagery you get. Level 0 or 1 is usually top-of-atmosphere (TOA) radiance while Level 2, 3, and sometimes 4 are bottom-of-atmosphere (BOA) radiance, meaning satellite imagery has been processed to eliminate the effects of atmosphere on the water/land leaving signal. Sometimes, standard satellite algorithms lead to erroneous results in complex water types which is why researchers choose to process imagery using other atmospheric correction and bio-optical algorithms.
Here is a list of interactive online tools for displaying, manipulating, and downloading various remote sensing data (in no particular order):
- Giovanni: NASA’s Giovanni is an online tool that displays Earth science data from NASA satellites. Data can be displayed in a variety of formats, including area plots, time series, composites, and more. Animations and numerical outputs are also available. The Giovanni User Guide and User Resources provide helpful assistance on how to analyze data products. It is also possible to download data directly from Giovanni.


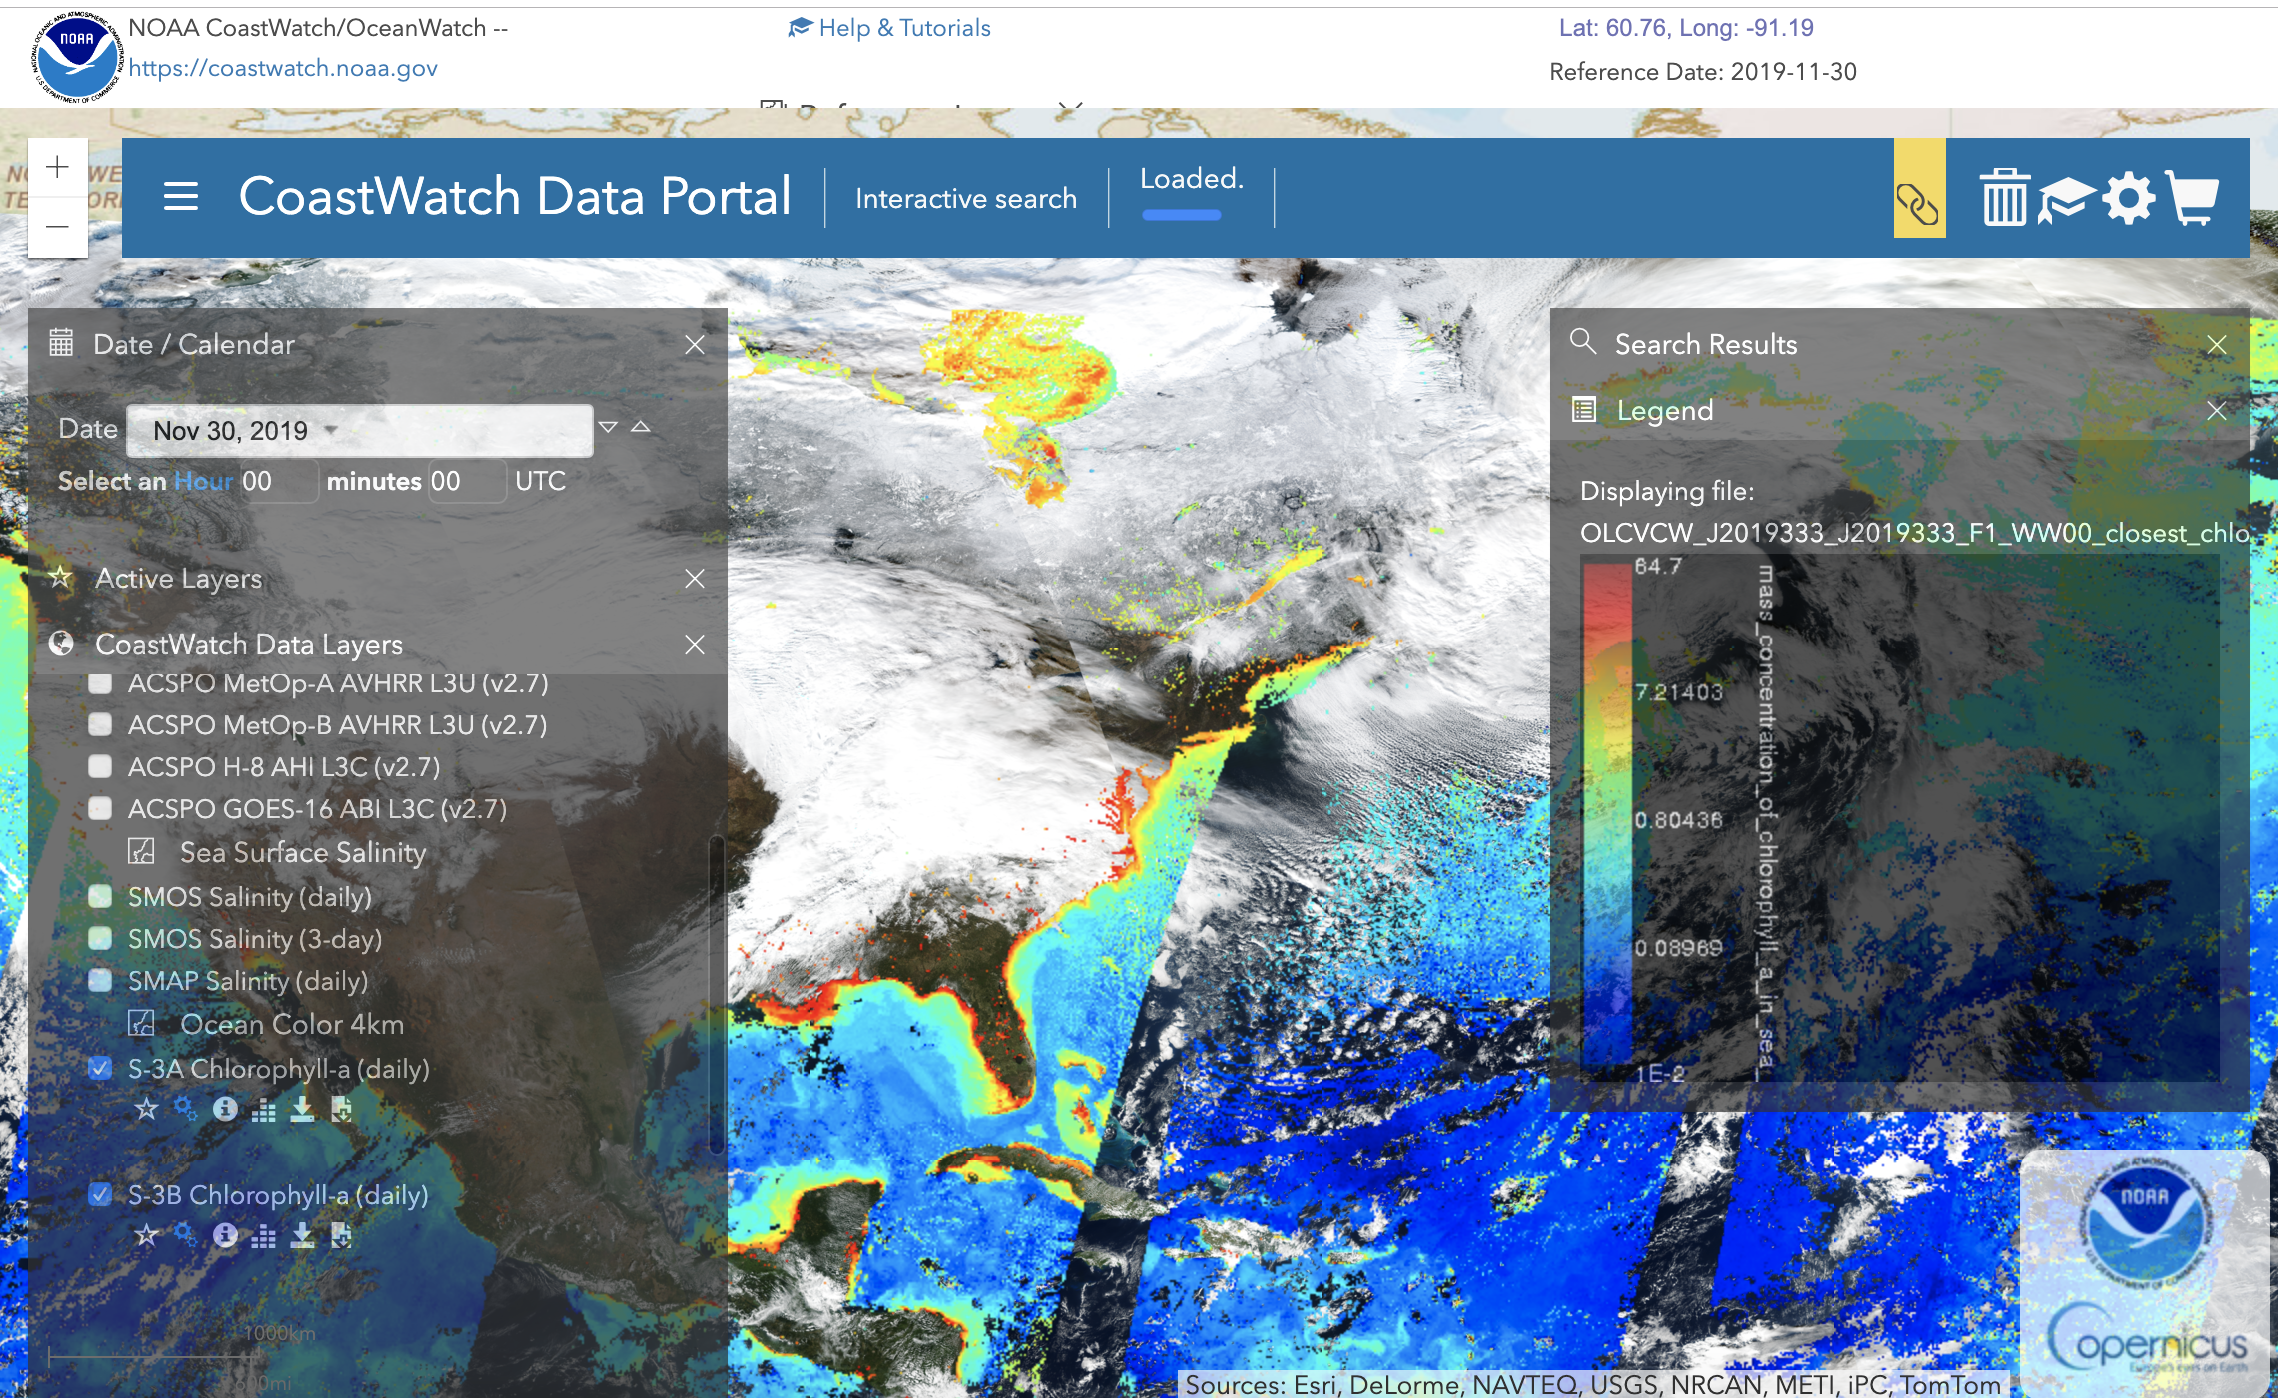
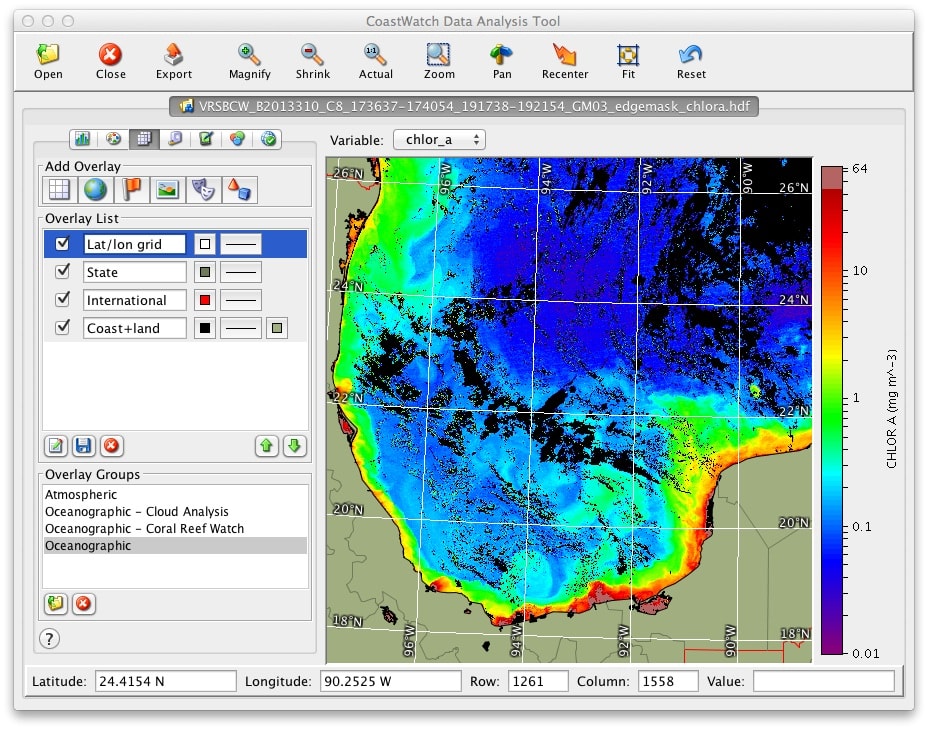
- NOAA CoastWatch: CoastWatch was developed to facilitate the use of ocean satellite data to assess impacts of environmental change. It provides a variety of environmental data (i.e. sea surface temperature, ocean color, winds, etc.) from several satellite platforms covering all U.S. coastal waters. CoastWatch has several interactive data search tools to visualize and download data. CoastWatch also has a downloadable software, CoastWatch Utilities which has more capabilities to manipulate and analyze satellite imagery.
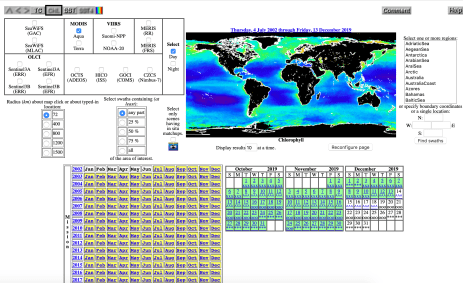
- NASA Ocean Color Data: NASA’s Ocean Biology Processing Group (OBPG) supports a large archive of processed satellite imagery from a number of satellites. Under ‘Data’, you’ll find data browsers for Level 1 & 2 and Level 3 data. The Level 1 & 2 browser allows users to browse data by date, sensor, and location. Selecting ‘Find Swaths’ takes you to a page where you can order or download data.
The Level 3 browser allows users to visualize and download global composites which average satellite-derived values over months or seasons. Level 3 data is useful for studying global oceans.

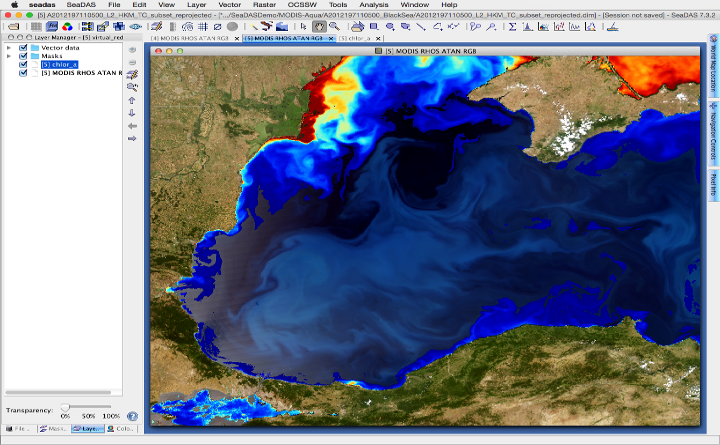
NASA’s OBPG also supports a powerful software package for visualizing and analyzing satellite imagery called SeaDAS (Software design for processing Satellite Data). The science processing component of SeaDAS can also be downloaded and used with a Linux or Mac OS X computer operating system to process data using additional algorithms. Windows SeaDAS version currently does not support the science data processing code, but can be used via virtual machine. NASA’s OBPG has an extremely helpful forum where you can ask questions that are usually promptly answered!
- Copernicus. This can get a little confusing. The Copernicus initiative is Europe’s system for monitoring the Earth using satellites. It’s implemented in partnership with the Member States, the European Space Agency (ESA), and the European Organization for the Exploitation of Meteorological Satellites (EUMETSAT). ESA is responsible for the development of the space segment component of the Copernicus program and operates Sentinel-1, Sentinel-2 and Sentinel-5P satellites. ESA also delivers the land mission from Sentinel-3. EUMETSAT is responsible for operating Sentinel-3 satellites and delivering the marine mission from Sentinel-3.
ESA controls the Copernicus Open Access Hub which provides free access to all Sentinel satellite data through an interactive graphical user interface. Files can be downloaded directly from this site.

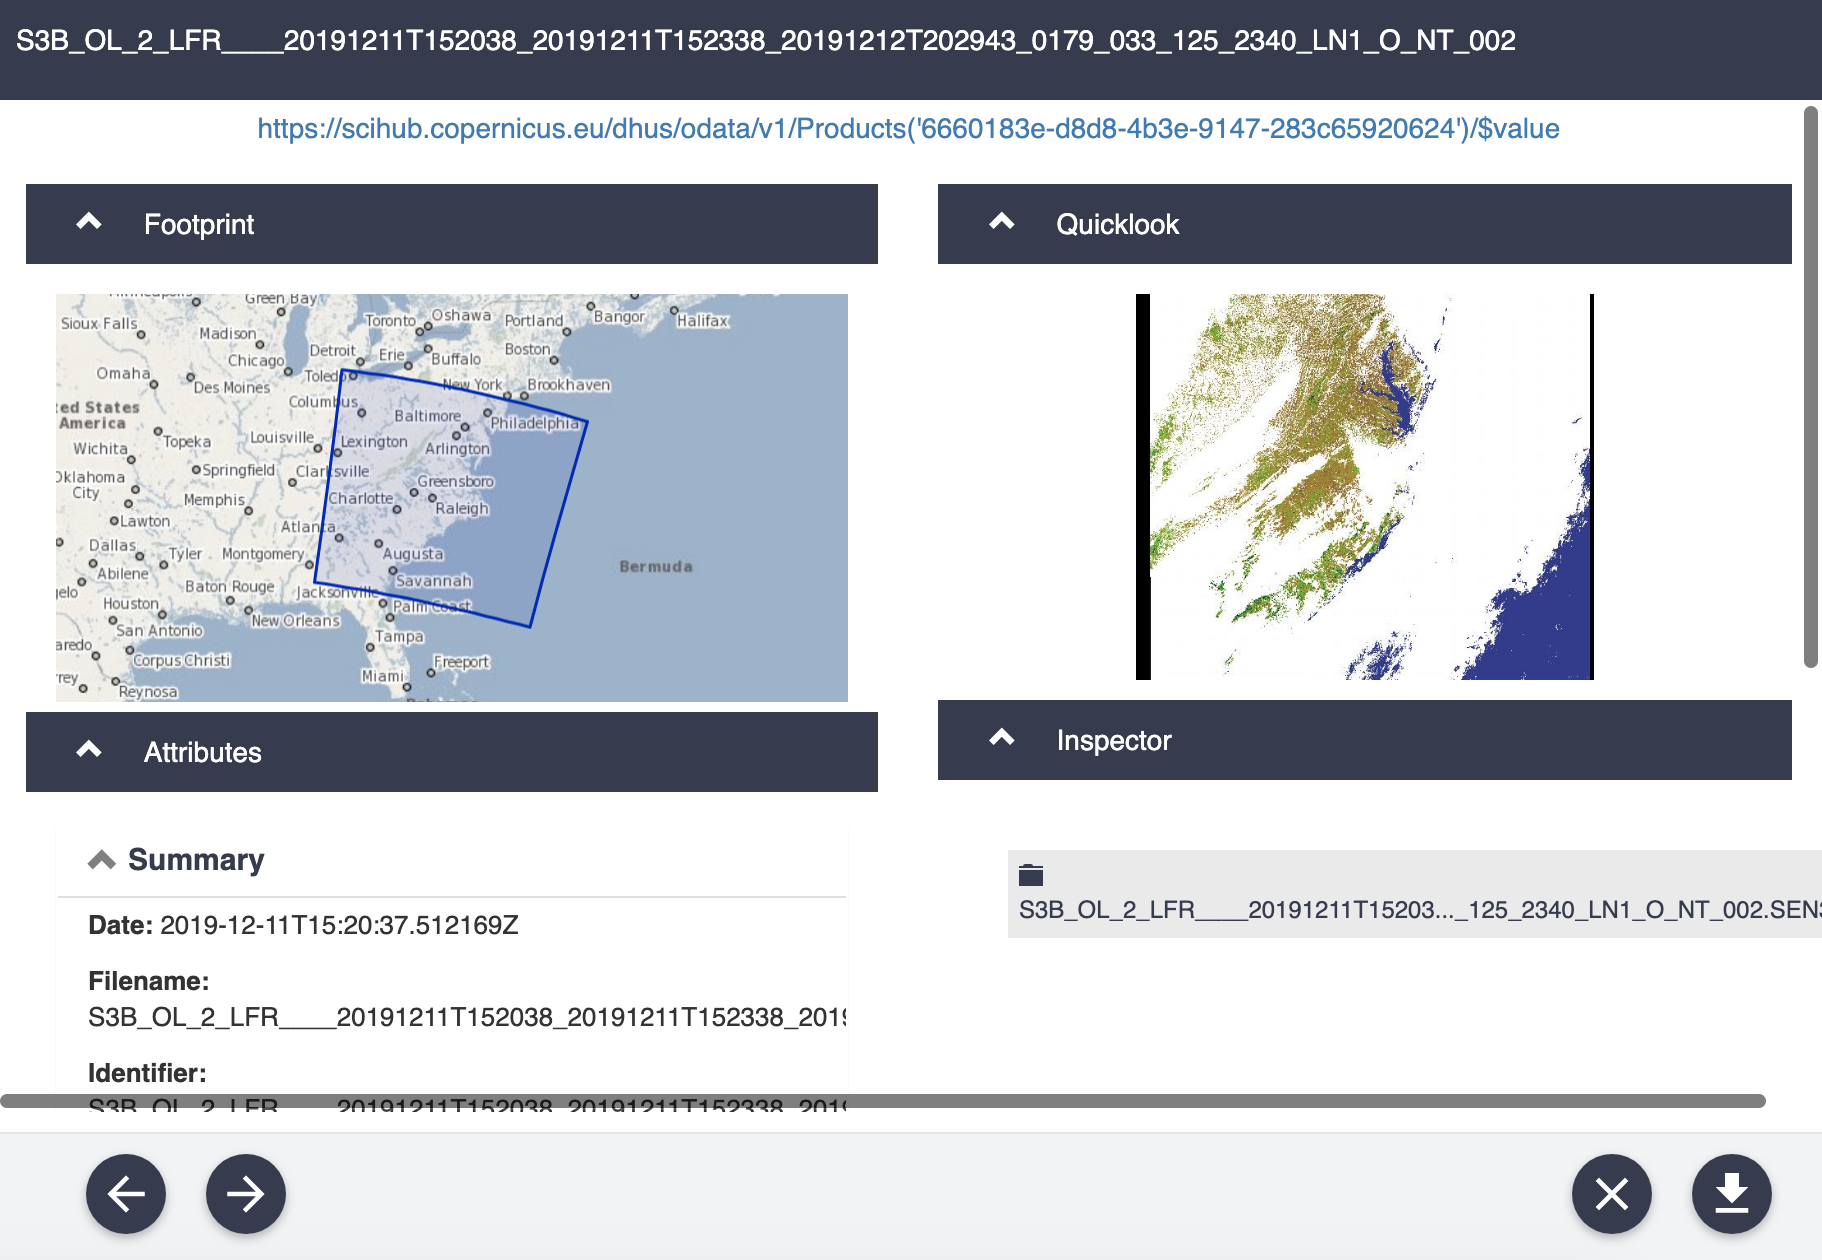
EUMETSAT controls the Copernicus Online Data Access (CODA) which provides free access to Sentinel-3 products through a 12 months rolling archive with access to Level 1 and Level 2 Marine data. Files after 12 months can be downloaded from EUMETSAT’s Data Center which provides a long-term archive of data. When processing algorithms are periodically updated, users can access reprocessed data from the online archive at CODARep.
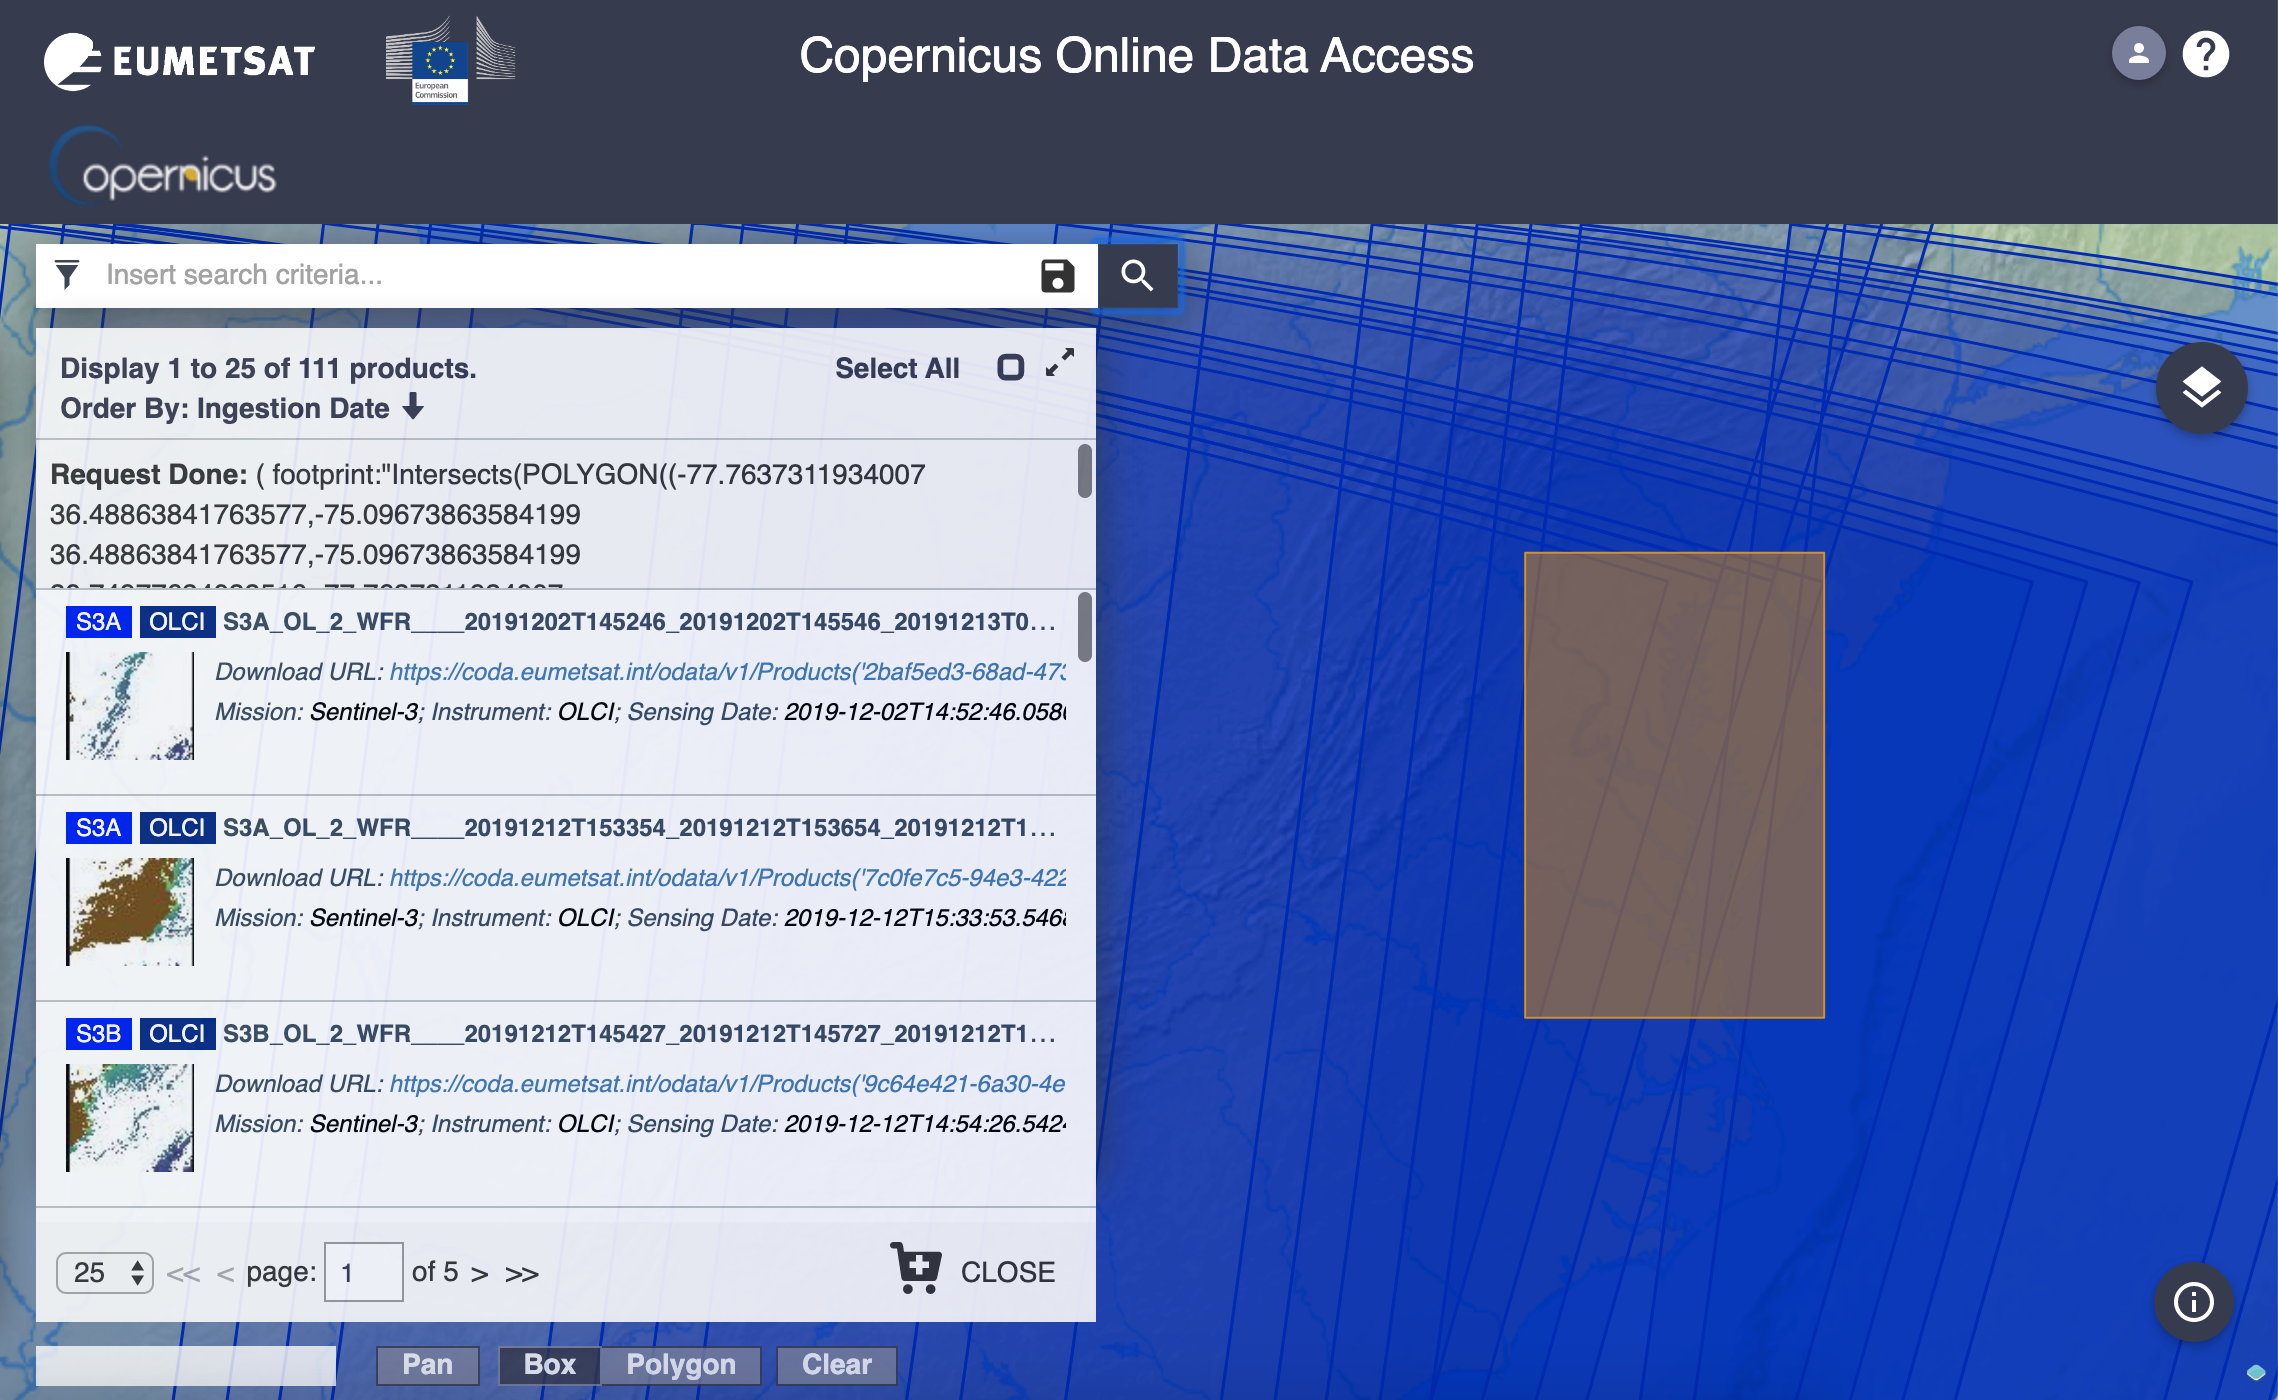
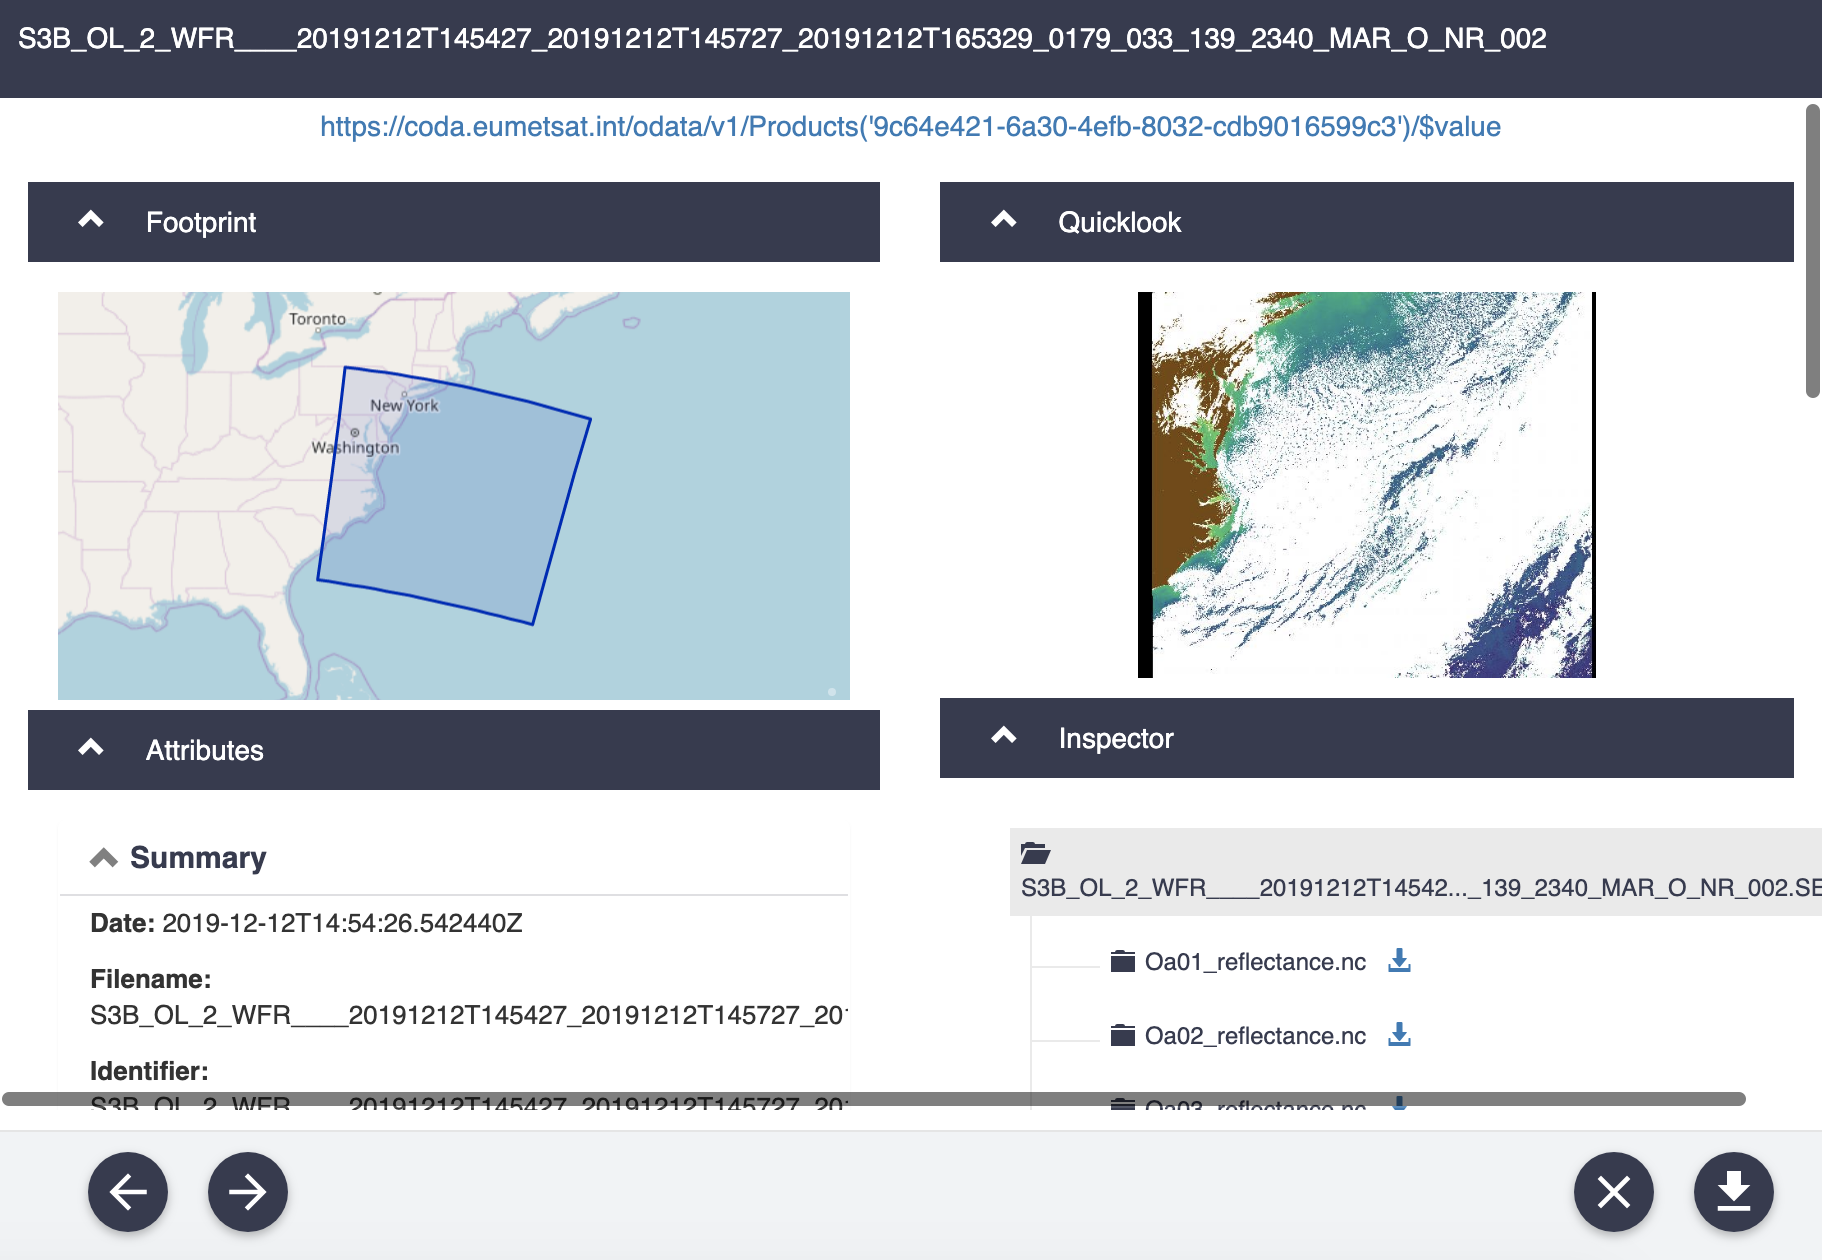
Both user interfaces allow users to set different parameters (geographic area, time, type of product etc) to refine their search in the archive of products.
Similar to NASA’s SeaDAS, ESA provides the Sentinel Application Platform (SNAP), an open source software for the exploration of Sentinel data. However, other satellite products can also be utilized in SNAP. After downloading onto your computer (available for Windows, Mac OS X, and Unix), users can use Sentinel Toolboxes to open and explore a satellite product. Capabilities include band math, pixel extraction tools, visualizing spectrum of pixels, and more. There are numerous tutorials and a helpful forum to get users started with SNAP.
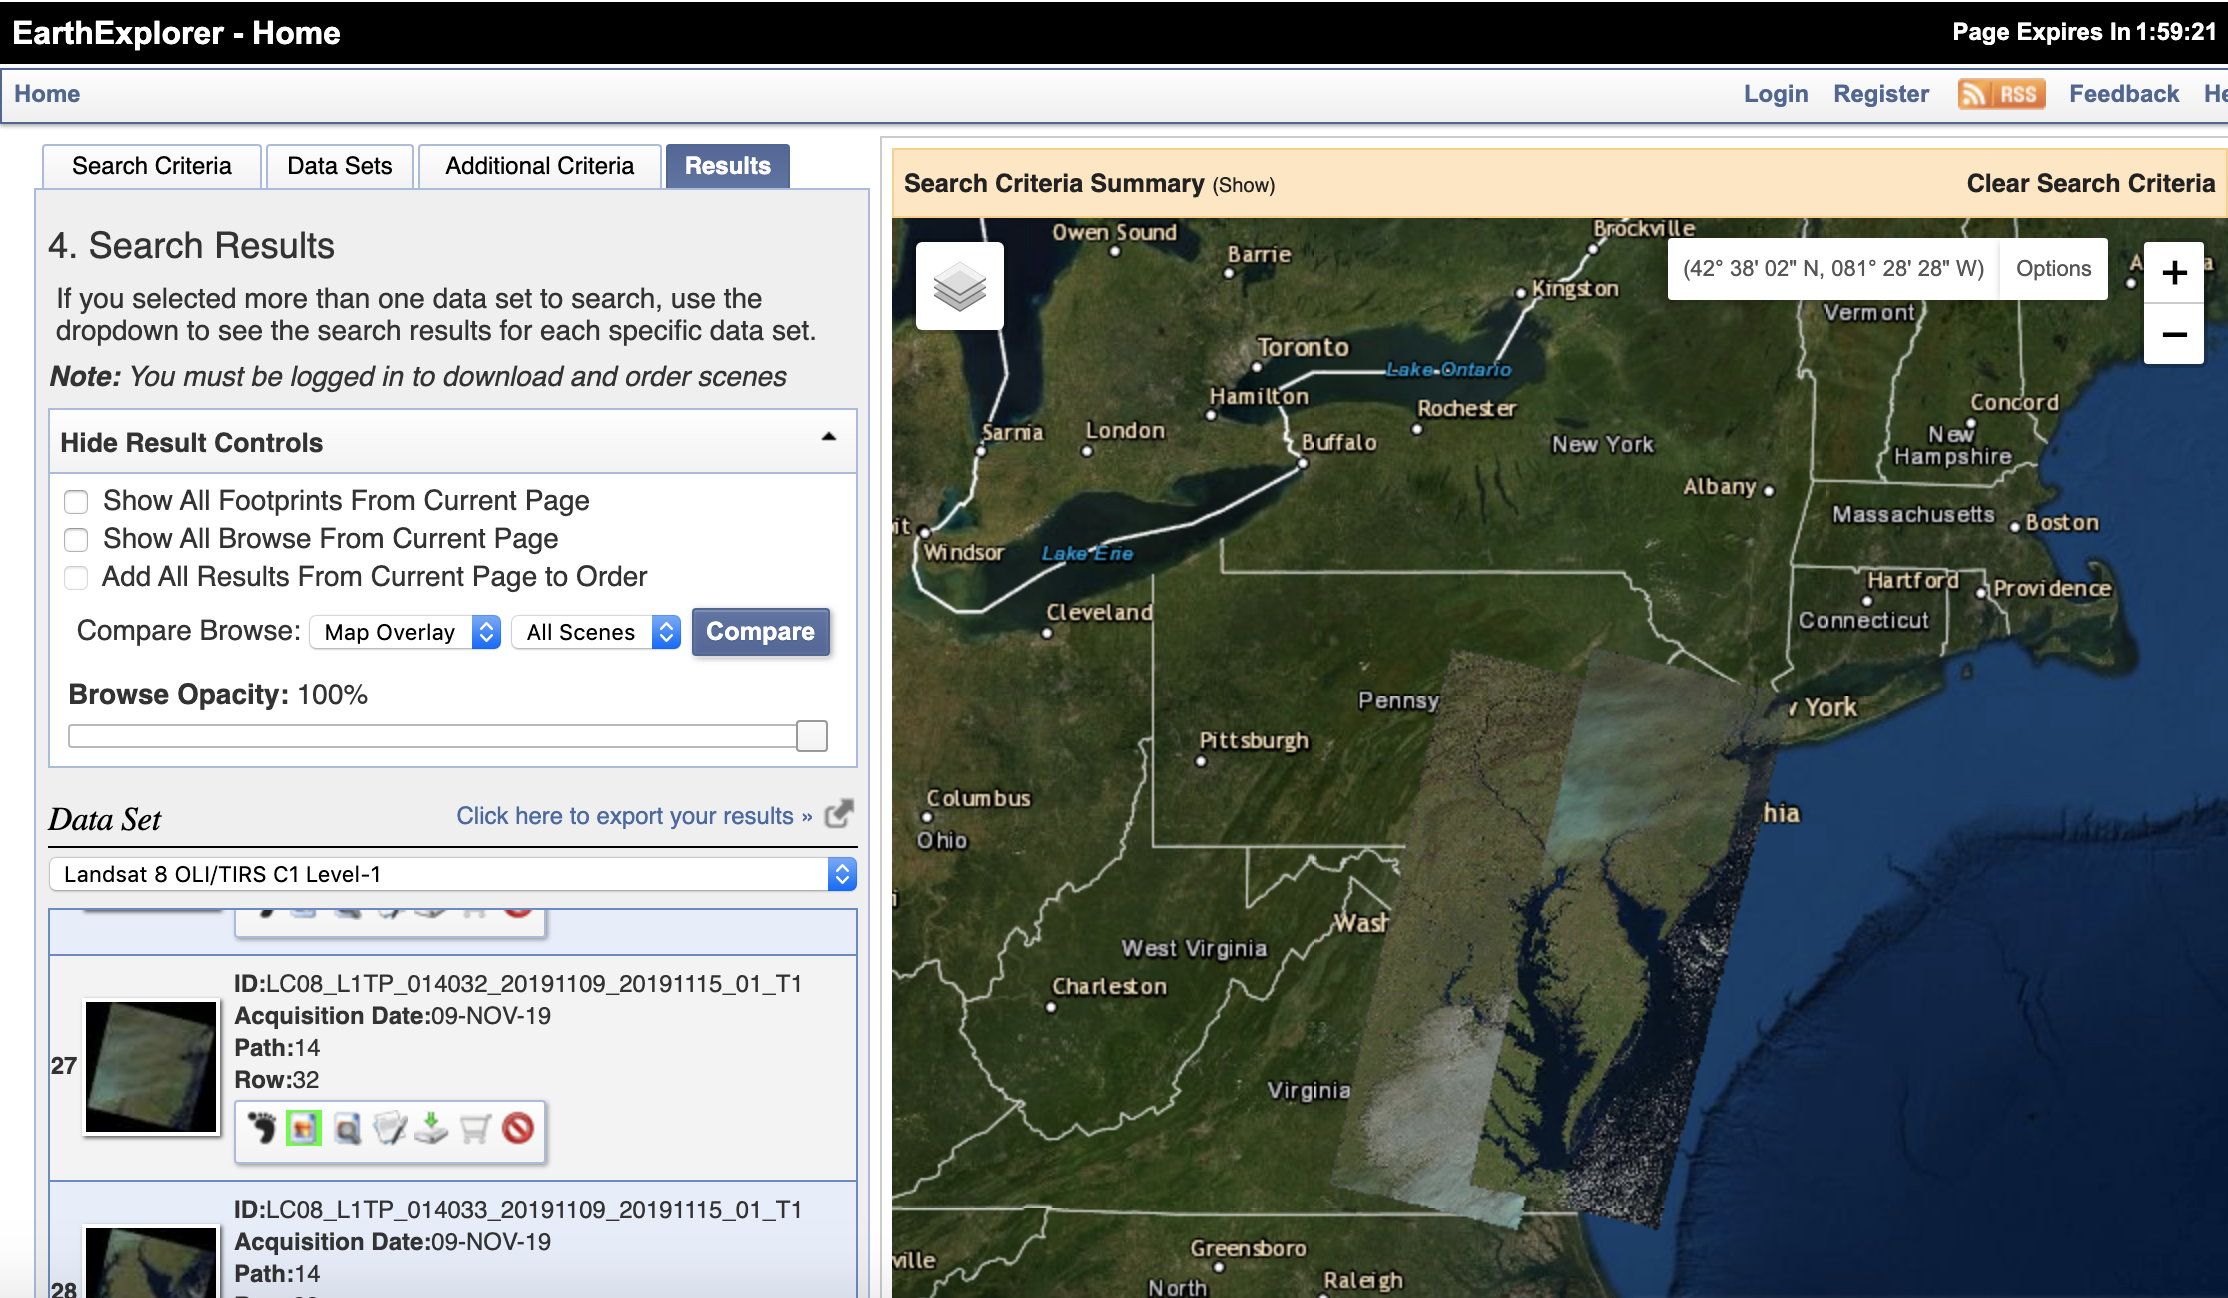
- USGS EarthExplorer: Another visualization/downloading tool by the USGS supports the access of free satellite, aerial, and other remote sensing datasets through interactive and text-based query capabilities. EarthExplorer data is focused on terrestrial applications.
This is not an exhaustive list as there are certainly other ways to visualize and download satellite imagery. If you have any other suggestions, please let me know and I will add them to my list!
