May 20, 2020
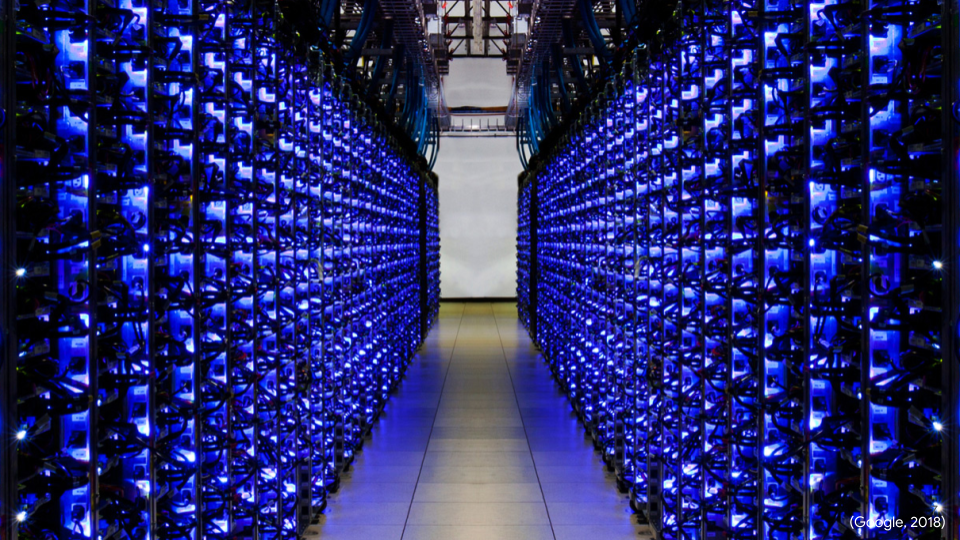
What is all the hubbub about Google Earth Engine (GEE)? GEE is a cloud-based platform for geospatial data and analysis. Most of us are becoming more familiar with personal cloud storage services such as iCloud and Google Drive. Similarly, GEE stores archived datasets and provides a computing platform for large-scale geospatial analysis in the cloud. GEE is powered by Google’s computational resources, providing users with essentially a high performance supercomputer. GEE hosts more than 40 years of free, publically available remotely sensed data in an organized data catalog which can be visualized and controlled through a web-based integrated development environment (IDE) called the Code Editor. All you need to access more than 50 petabytes of Earth observation data to conduct planetary-scale analyses is a simple internet connection. More details about GEE can be found in this article.
So what’s the big deal? GEE has significantly transformed the way scientists access and use remote sensing data. Historically, data would come off satellites and be converted onto physical tapes that were stored in a government vault, limiting user access. Currently, most remotely sensed data is stored in Distributed Active Archive Centers, or DAACs, hosted on an organization’s server. Users can download files directly to their local computer; however, increased storage and computational power is typically needed for large-scale analysis. Understanding that increasing ‘big data’ was requiring larger computing resources, Google designed GEE towards the end of 2010 with the goal of digitally storing remotely sensed data in the cloud, letting scientists focus on science instead of downloading and managing data.
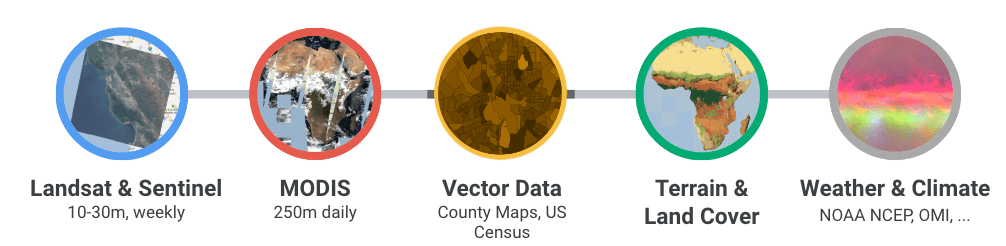
The Earth Engine Data Catalog includes 40 years of Landsat imagery, weekly Sentinel constellation data, MODIS data, and also non-satellite data such as elevation, land cover, climate data, topography, and vector data. The data catalog is updated hourly and receives about a petabtye of new data per month.
Remotely sensed imagery can be challenging to work with. There are typically gaps in data due to long revisit times or areas with cloud cover. But since satellites are collecting many images throughout the years over the same place, a cloud free composite can be created. Actually, this is how the basemap for Google Earth and Maps was created. This composite would have taken 14 years on one computer but because it was run in parallel on 10,000 computers at Google, it took only a couple of days.

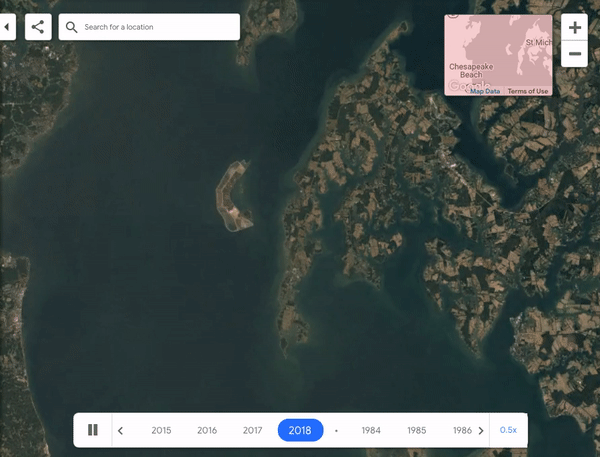
Before I go more into GEE, I want to introduce Google Earth Timelapse, a global animation of cloud-free Landsat images from 1984 to 2018. This global timelapse function would have taken 300 years to make on a single computer, but using Google’s parallel processing it only took three days to process. It’s interesting to see how different places have changed over almost four decades.
There have been several highly cited papers in high impact scientific journals that have used GEE in their analysis. One paper led by Dr. Matthew Hansen, professor at University of Maryland, describes a GEE workflow using Landsat data to characterize forest extent, loss, and gain from 2000 to 2012. As of today, this paper has been cited 5,266 times and is considered the first big science result done on GEE. This research, now called Global Forest Change, is an operational application that is updated every year.

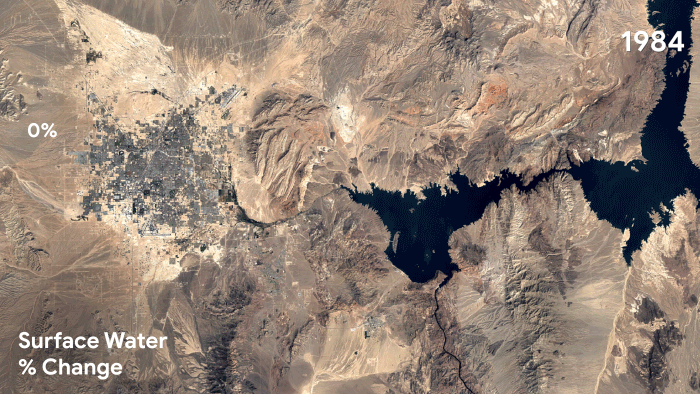
Another significant paper published by the European Commission Joint Research Centre in 2016 describes how 30m resolution Landsat imagery was used to map the occurrence and change of surface water over a 32 year period. The data can be viewed in the Global Surface Water Explorer where users can interact, derive statistics, and download the data. This research provides a consistent way of measuring water and its changes over time which has helped form sustainable environmental policies.
While GEE does ease facilitation to data access, there is a learning curve, even if you are an experienced programmer. GEE provides a built-in Javascript application programming interface (API) and an option for a Python API installation. I’ve dabbled in GEE for a couple years now and have slowly come to understand the basics and the overwhelming capabilities it holds. Therefore, I want to share what I have learned in hopes of inspiring others to start exploring this awesome tool. Here are some tips to start you out:
- Well first, you have to sign up! All you need is a gmail account to create an account. It can take several days to get a confirmation email but once you verify your account, you’re good to go.
- Take a look at the Developer’s Guide. It’s a lot of information that you’ll find yourself constantly referring back to. The ‘Get Started’ page provides some resources if you are new to JavaScript. However, I found myself learning JavaScript more effectively by just playing around with it in the Code Editor.
- The easiest way to start playing with imagery is to grab a snippet of code listed at the bottom of a dataset page in the Data Catalog. For example, this USGS Landsat 8 Surface Reflectance webpage has a snippet of code you can use by simply copying and pasting into the Code Editor or by pressing ‘Open in Code Editor’.
- Create an GIS Stack Exchange account and don’t be afraid to post questions! When I am stumped with a code, I post a question and typically get a response within 1-3 days. It’s also a good place to look for answers and grab code that might work for what you’re trying to accomplish.
- A powerful way to communicate your research is through visualizations (see my last blog post!) GEE has some really amazing animation functionality to display data of interest or a spatiotemporal change. I find myself revisiting this page in the Developer’s Guide often to test out the different ways GEE can display data such as GIF animations, thumbnail filmstrips of images, transitions, and more.
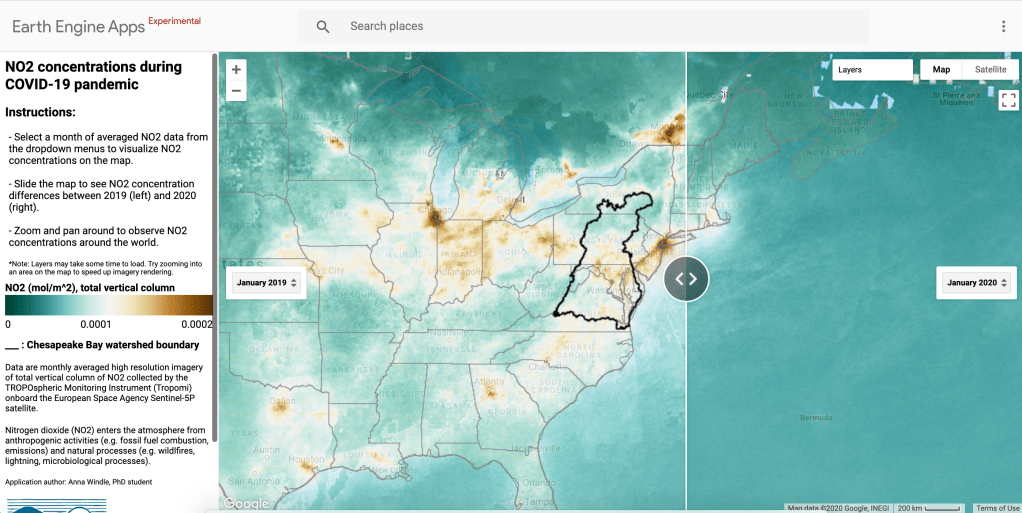
6. Another powerful way to display and distribute your data is through an Earth Engine App. These online interfaces bundle data into interactive experience to different users. They are published from GEE and are accessible from an application-specific URL. A GEE account is not required to view or interact with a published App. I recently published an app about air quality during the ongoing COVID-19 pandemic.
7. I mentioned that GEE has a Python API available. The package, called ee, can be downloaded and used locally without the need to utilize a web browser. If you are already used to Python, this might be a good option. You can integrate other packages for visualization and charting such as Matplotlib, Folium, ipyleaflet, etc. An additional GEE Python package, geemap, was developed by Dr. Quisheng Wu, Assistant Professor at University of Tennessee. This package allows for interactive mapping with GEE, ipyleaflet, and ipywidgets. His Jupyter notebook examples and YouTube tutorials are super useful.
While GEE has many valuable features and computational benefits, there are some things to be cautious about:
- Band values: It’s always a good idea to do some research on the dataset you’re using. For instance, in the description for USGS Landsat 8 Surface Reflectance Tier 1, it states the dataset is atmospherically corrected using LaSRC. Will this atmospheric correction algorithm provide accurate remote sensing reflectance values for your analysis? This is also especially important if you are attempting to derive water quality parameters from reflectance data.
- Spatial resolution: Most of the remotely sensed products or model derived data have coarse resolution since they provide coverage for the entire globe. In this case, using GEE to do an analysis on a smaller study site might be disadvantageous.
- Dataset availability: Make sure to always check the dataset availability listed at the top of the dataset webpage. Some datasets are only available for a few years, and would not be available to use for presently occuring research.
GEE has been gaining a lot of attention worldwide; the number of studies that have used GEE in past few years has skyrocketed and some scientific journals have even created special issues consisting only of GEE applications. Remote sensing scientists no longer need large processing powers, the latest computers, or the latest software. All they need is an internet connection and a research question. GEE allows researchers from all over the world with different resource capabilities to undertake analysis and produce some exceptional studies, which I think is pretty remarkable.
