November 14, 2019
In my first of three satellite remote sensing blog posts, I gave an overview of remote sensing basics, defined commonly used terms, and described why scientists study optical properties of water. For my second blog post, I will go more into depth on aquatic remote sensing, often termed ‘ocean color’ remote sensing.
Ocean color satellites fall into the category of earth observing (EO) satellites. According to the Union of Concerned Scientists’ satellite database, there are currently 791 public and private satellites operating in space for the main purpose of earth observation. These satellites are designed to monitor the planet’s terrestrial and aquatic environments over an extended period, providing valuable information on key components of the climate system.
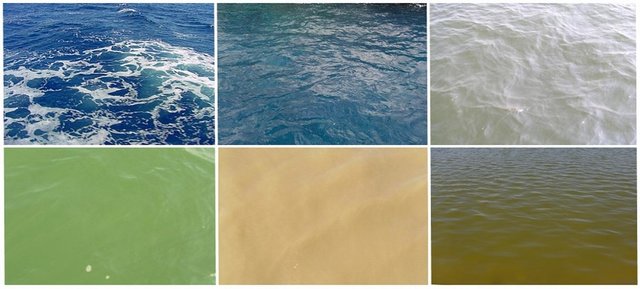
Why is ocean color important? It provides valuable information on the quality or health of water. The apparent color of water is a result of substances that are either suspended or dissolved in the water column (see IOPs section in first blog). Ocean color satellites detect spectral characteristics of these substances which provides estimations on the relative concentrations of water column constituents (i.e. sediment, chlorophyll) which can be used to answer scientific questions.
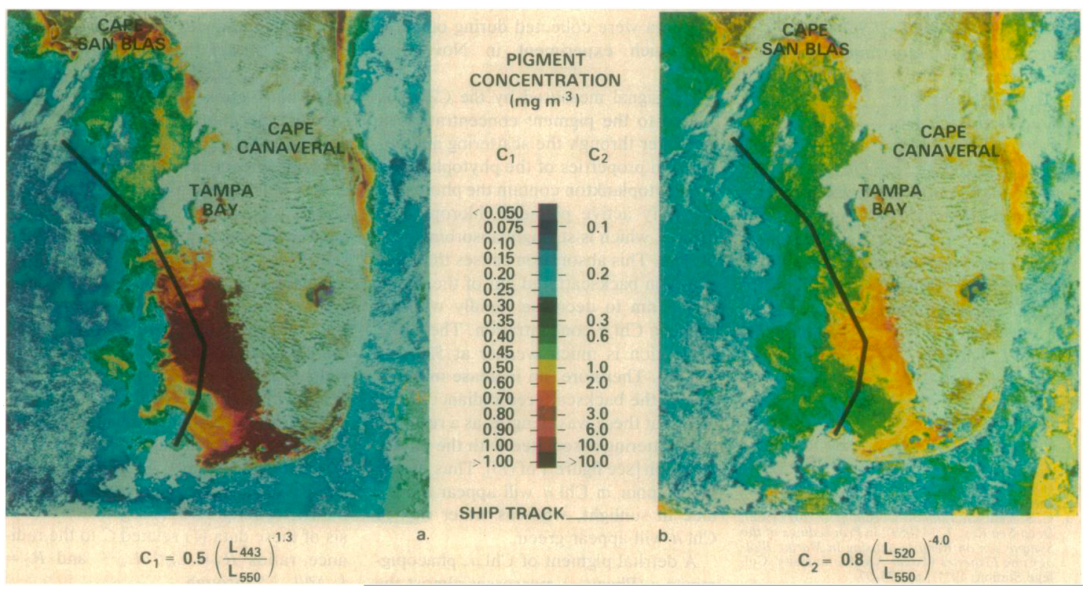
The first ocean color sensor was designed as a proof-of-concept instrument. The Coastal Zone Color Scanner (CZCS) was launched in 1978 on board NASA’s Nimbus-7 satellite. It provided the first maps of ocean chlorophyll concentrations, sediment distribution, salinity, and temperature of coastal waters and ocean currents (Gordon et al., 1980).
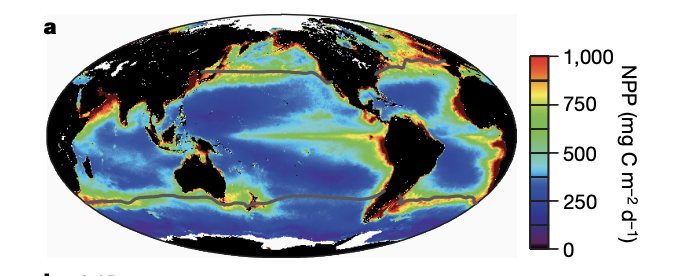
Two decades later in 1997, NASA launched the Sea-viewing Wide Field of View Sensor (SeaWiFS) onboard GeoEye’s OrbView-2 satellite for the sole purpose of monitoring global oceanic bio-optical properties. Data collected by SeaWiFS has greatly advanced the field of biological oceanography. SeaWiFS data provided the first global synoptic estimates of marine primary production (i.e. phytoplankton) which was used to observe how ocean productivity is linked to climate variability (Behrenfeld et al., 2006).
Other ocean color sensors include NASA’s Moderate Resolution Imaging Spectroradiometer (MODIS) onboard the Aqua and Terra satellite, the European Space Agency’s (ESA) Medium Resolution Imaging Spectrometer (MERIS) onboard ESA’s Envisat satellite (ended in 2012), and the Ocean Land Color Imager (OLCI) onboard ESA’s Sentinel-3A and Sentinel-3B satellites.
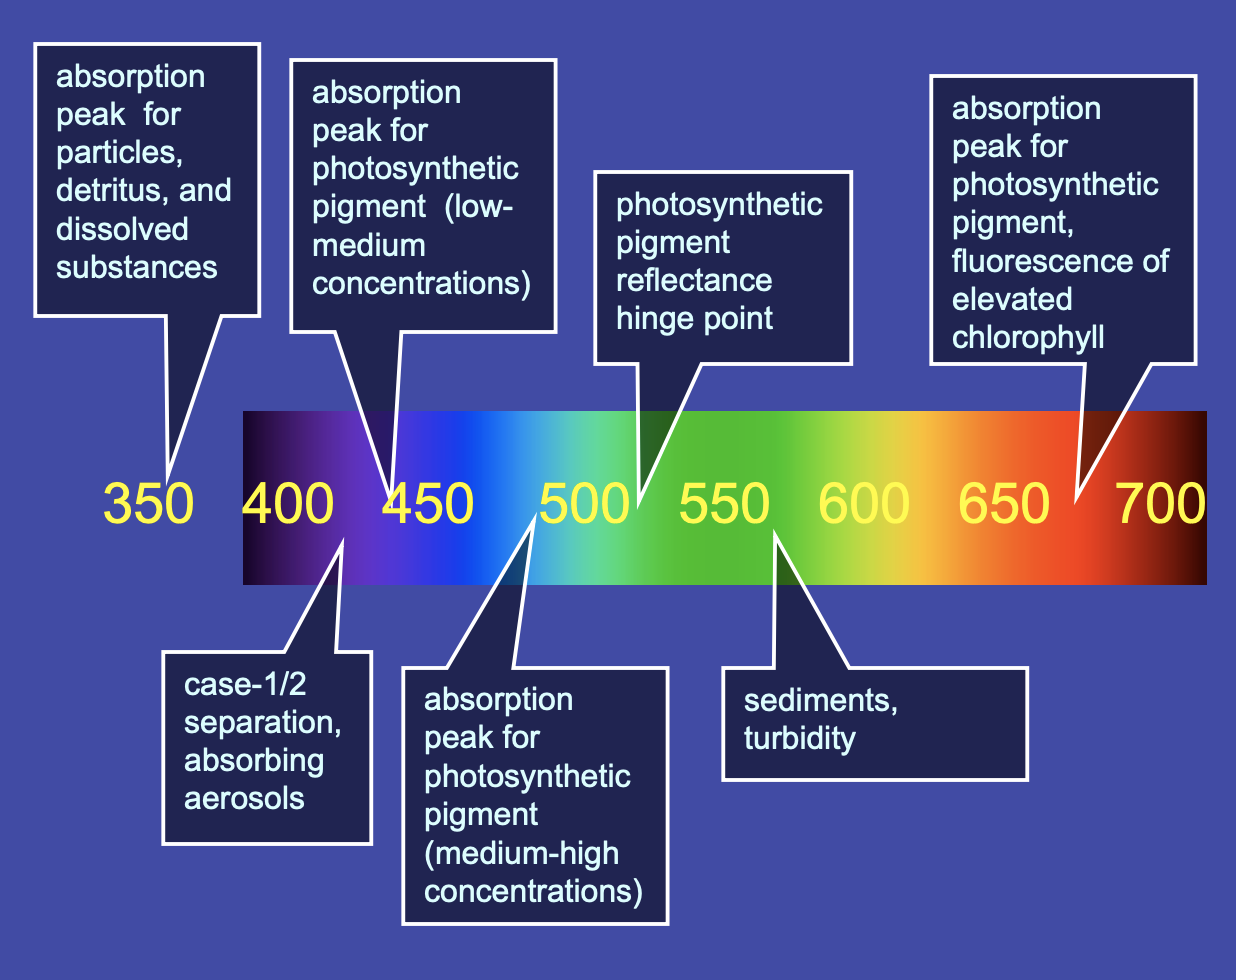
Ocean color sensors collect radiance in specific wavelength bands indicative of water. For example, Sentinel-3’s OLCI sensor collects data in 21 spectral bands ranging from visible to near infrared. The placement of these bands on the electromagnetic spectrum are known to reveal characteristics of water. OLCI’s band 3 centered at 442.5 nm collects data on chlorophyll absorption while band 5 centered at 510 nm collects data for sediment and turbidity detection.
Ocean color sensors are not just for detecting color in oceans. They are also used to study estuaries, rivers, and lakes. Scientists have adopted the term ‘ocean color sensors’ for all aquatic remote sensing. Earth observing satellites developed for terrestrial applications are also increasingly being used for aquatic remote sensing. Some of the higher resolution earth observing satellites are useful when studying smaller water bodies or narrow tributaries. The Operational Land Imager (OLI) onboard NASA’s Landsat 8 collects imagery with 30m resolution. It contains a coastal band (band 1) that is useful for aquatic remote sensing. The MultiSpectral Instrument (MSI) onboard ESA’s Sentinel-2 satellite collects data with 10m resolution. This instrument has been used to monitor spatial and temporal dynamics in small lakes (Ansper & Alikas, 2018)
Satellites can see the oceans in ways that are otherwise impossible. Oceans make up 70% of the Earth’s surface making monitoring by ships not feasible. Satellites can collect information on water quality over the entire planet in a matter of days. This type of information is critical to study how the earth is responding in near real-time to climatic changes.
Next satellite remote sensing blog post will focus on how to actually access satellite data- stay tuned!
References:
