October 18, 2018
A couple weeks back, Greg, Naz (post-doc at Horn Point), and I spent a beautiful day on the Choptank River collecting data for upcoming research. As it was the first day of my PhD fieldwork, I was excited! I couldn’t wait to explore the Choptank by boat and witness the beauty of this Chesapeake Bay tributary. It was a clear, calm, and surprisingly warm October day. We spent the morning packing the UMCES van full of equipment and drove down to the HPL boat docks. After loading up the boat, we were on our way to our first site: ET5.1 The eight sites where we sampled are a mix of sampling stations that either ShoreRivers (CR16, CR14, CR12, CR6) and Maryland DNR (ET5.1, ET5.2, EE2.1) use for water quality monitoring. We sampled at these locations due to the abundance of available data at these sites.
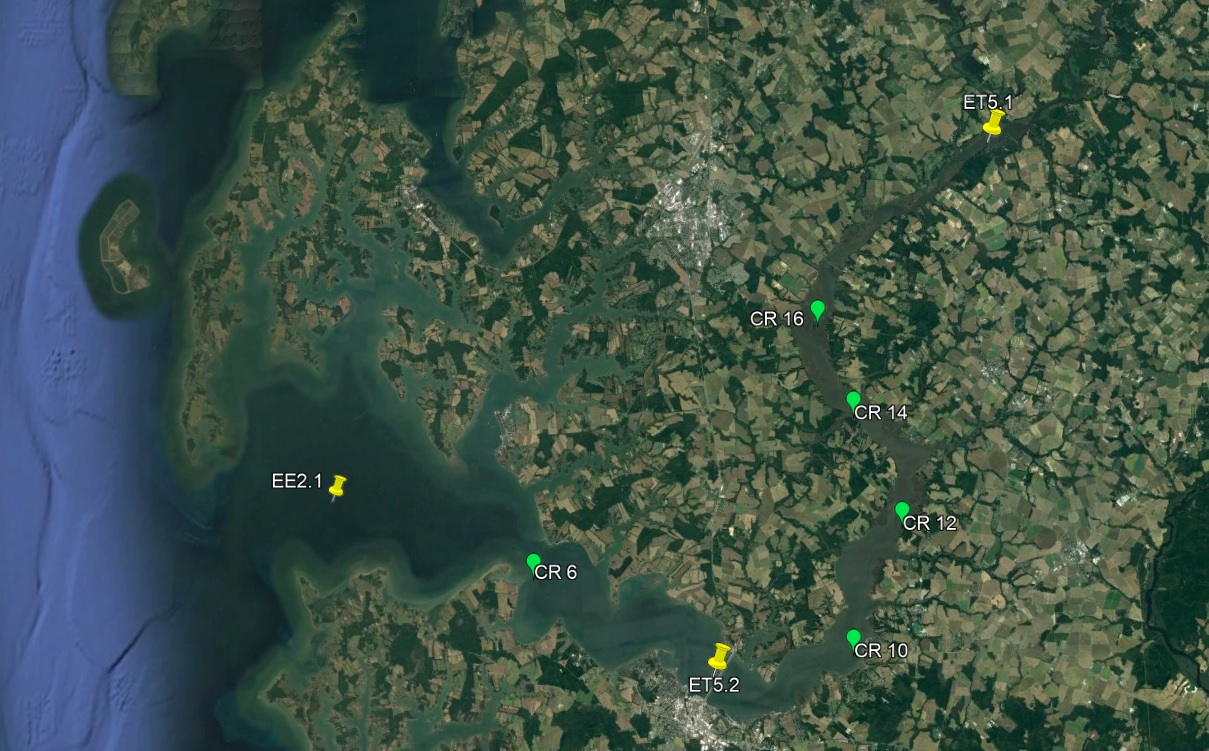
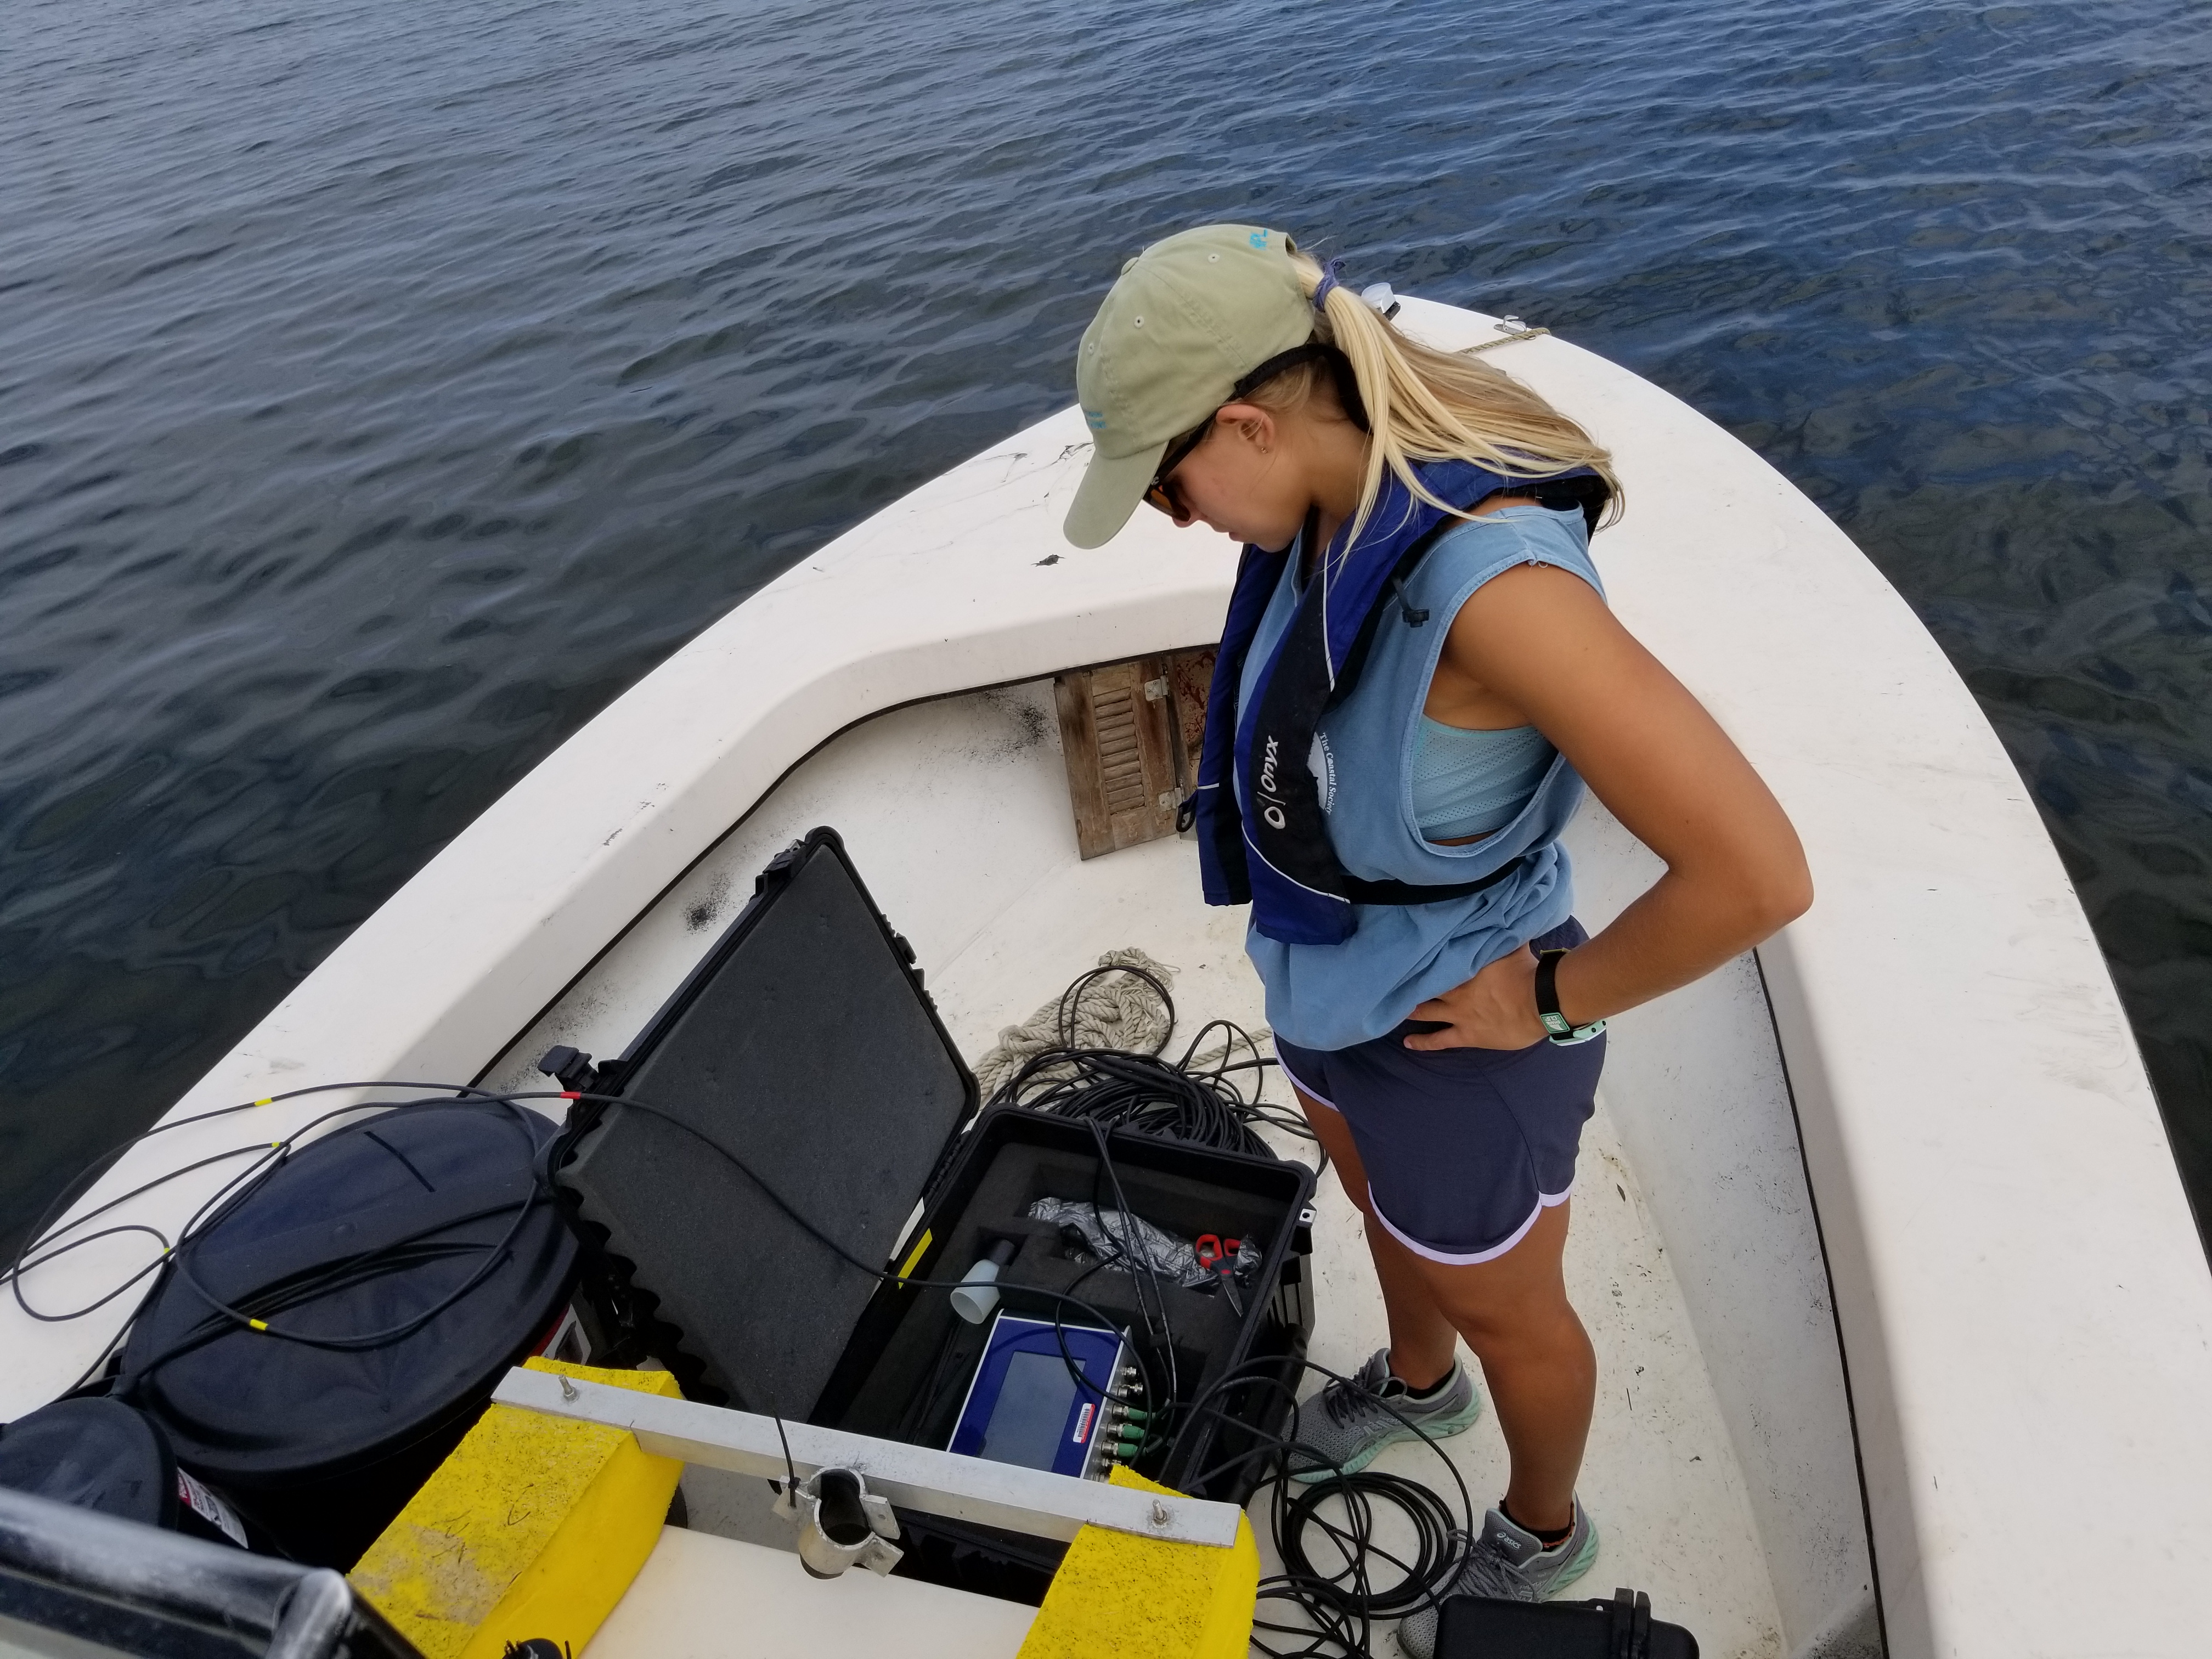
After traveling 18 miles upstream, we arrived at approximately 38.807°N, 75.912°W. Having never used any of the monitoring equipment in the field, I appreciated the time Greg took to explain how to use each piece of equipment.
We first set up the radiance and irradiance sensors on a floating platform. Together, these hyperspectral sensors measure remote sensing reflectance (RRs) of the water. Reflectance is the ratio of the amount of light leaving the water to the amount of light striking the water. An irradiance sensor points towards the sun and collects the amount of light that hits the water (downwelling irradiance) while the radiance sensor points down into the water and collects the amount of light leaving the water (water leaving radiance). These data emulate what NASA’s earth observing satellites employ to monitor aquatic ecosystems.
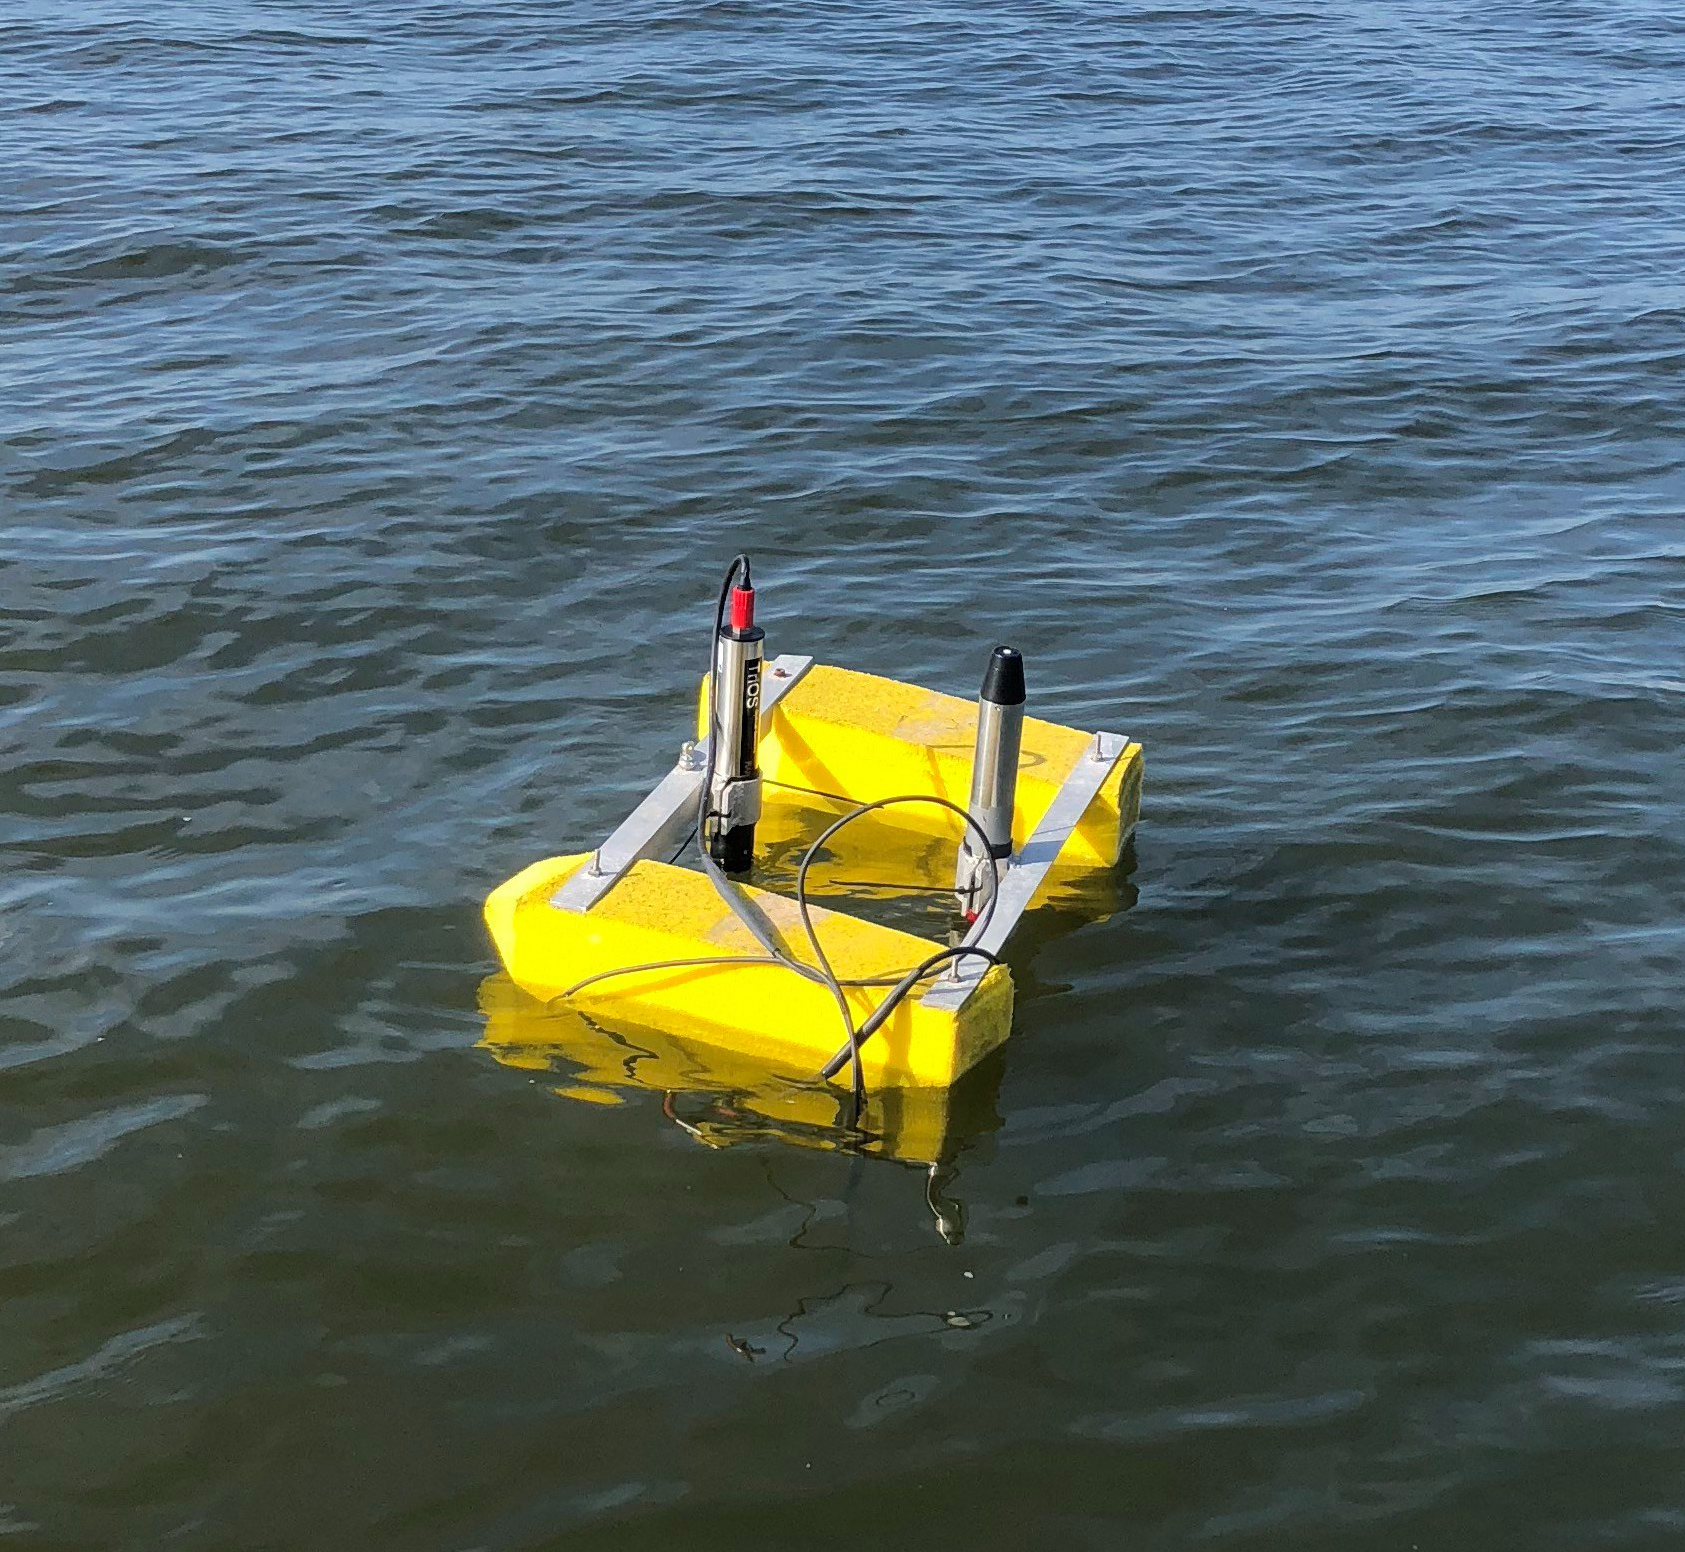
We also took irradiance measurements as the sensor was lowered down the water column to analyze how light penetration changes with depth.


We measured transparency of the water using a Secchi disk and collected water column samples by using a Niskin bottle, a device used to to take water samples at a desired depth.
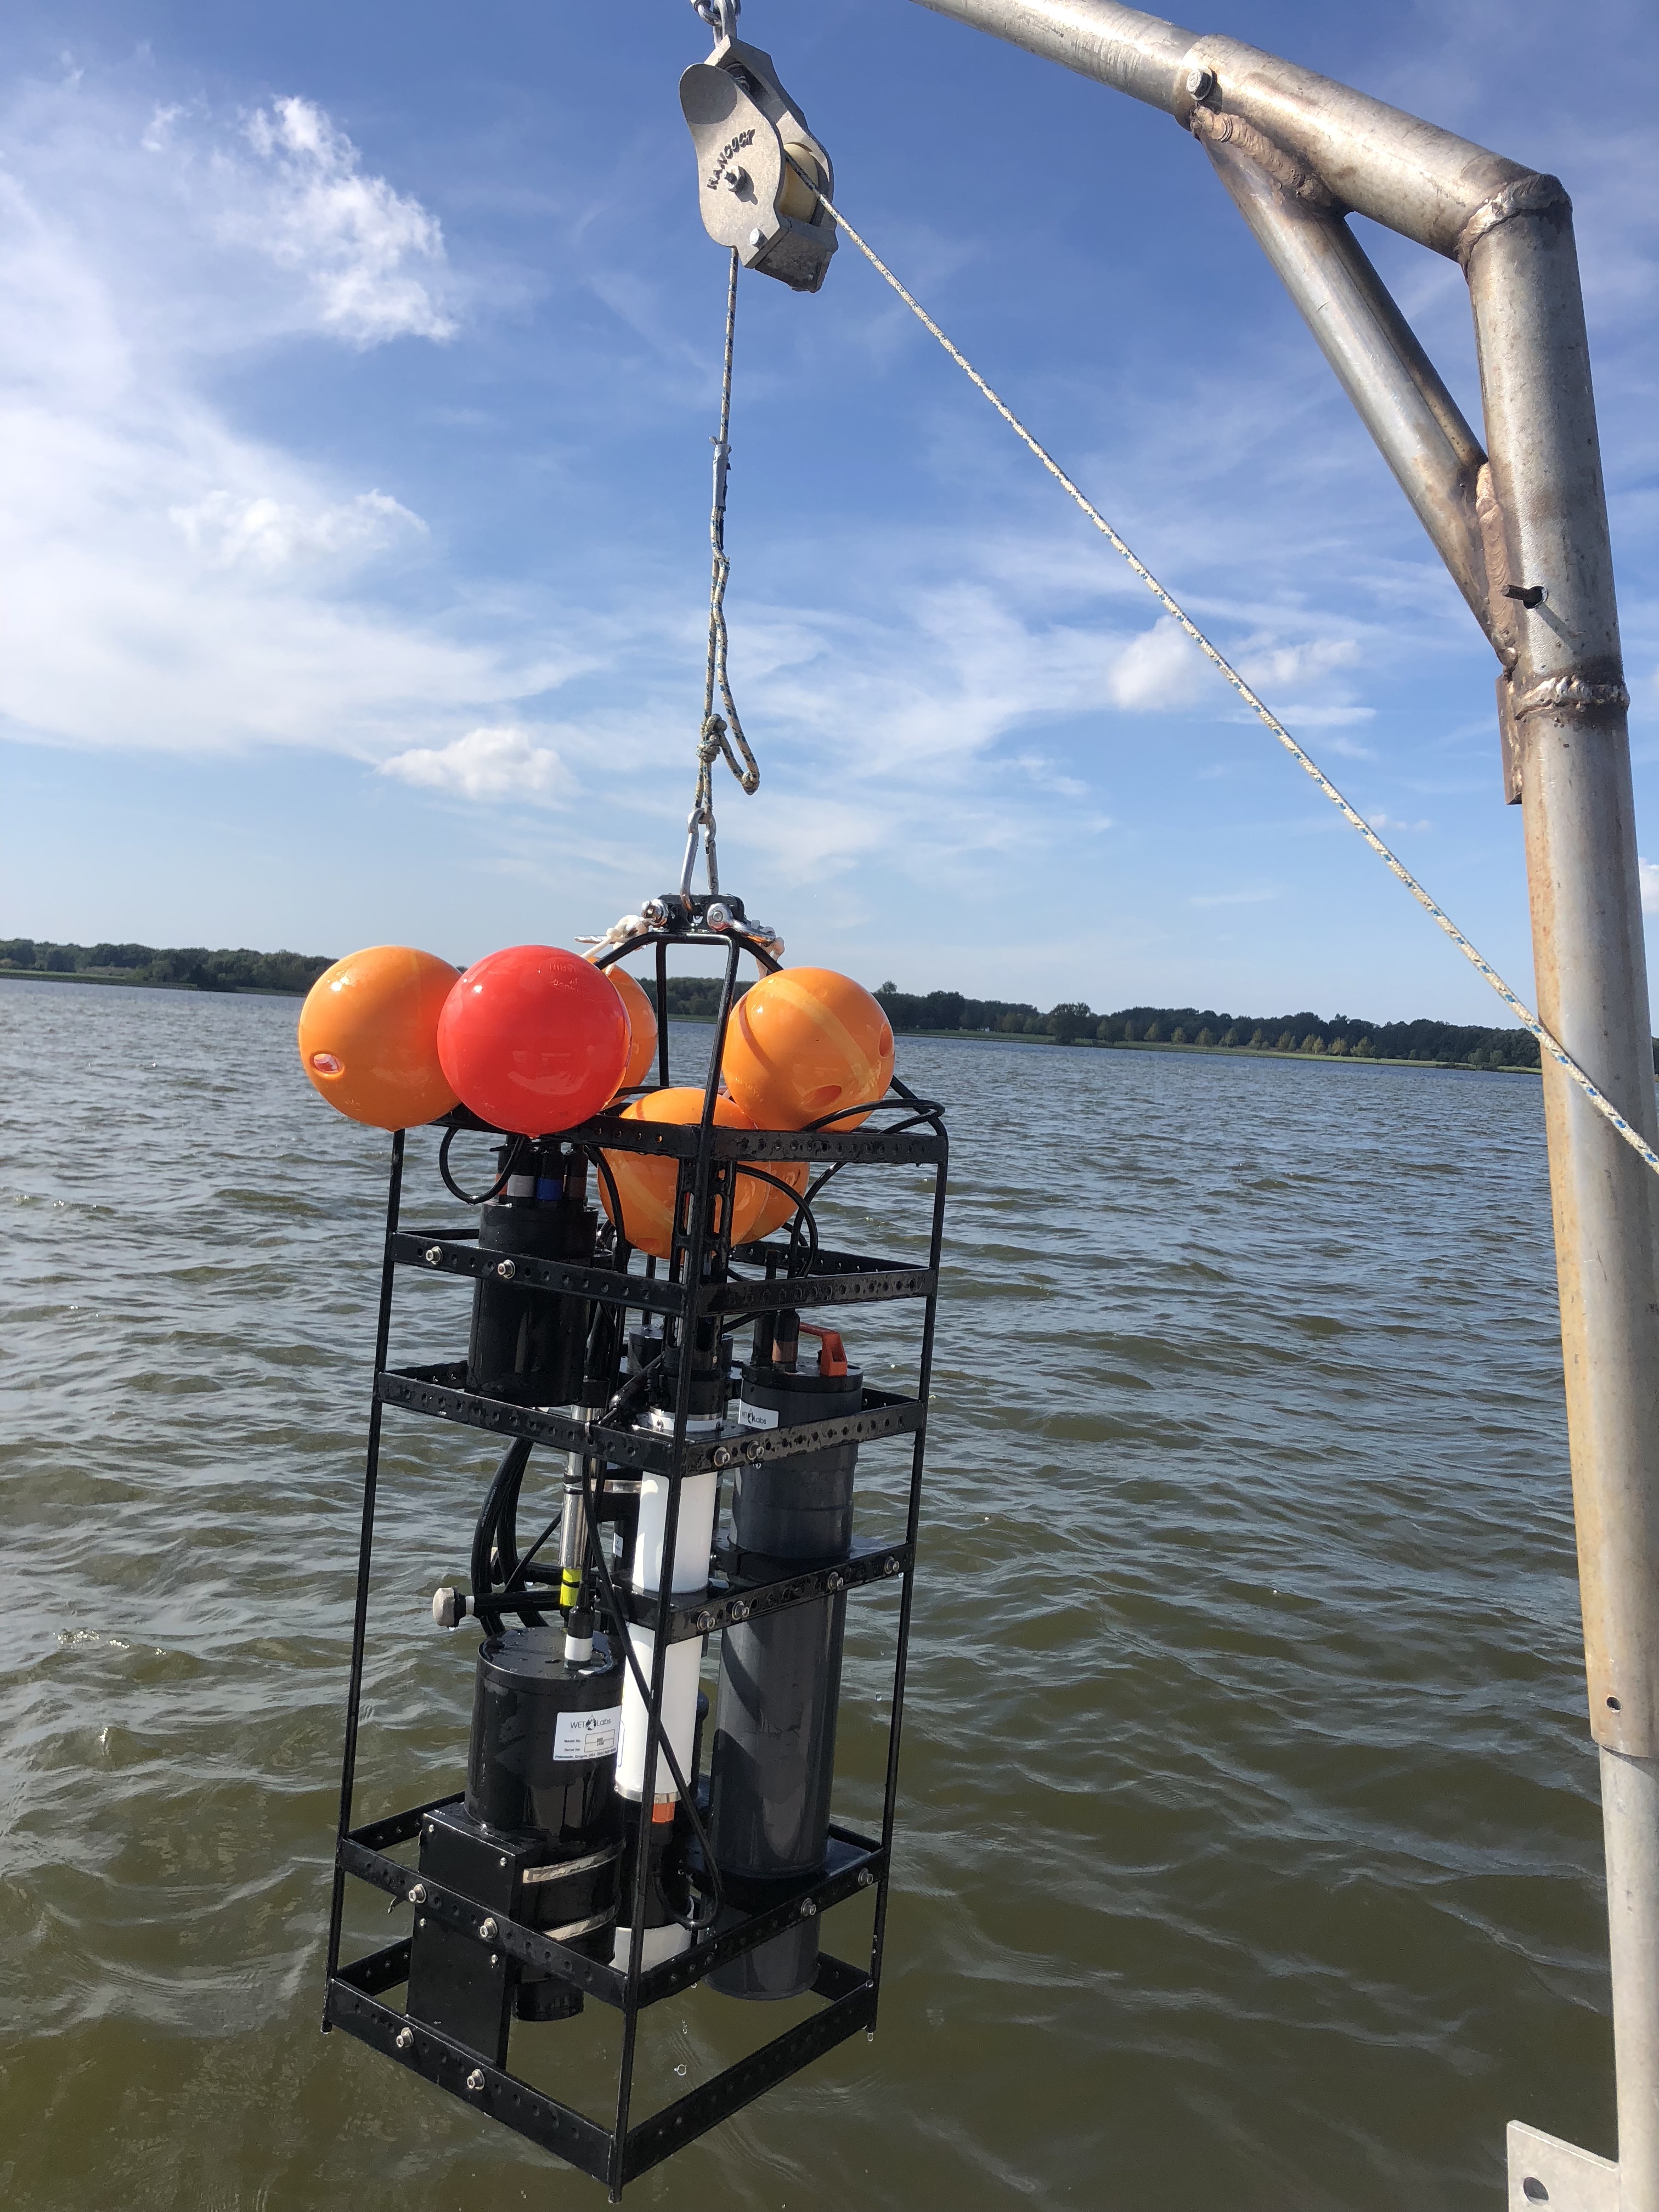
We then deployed the 90 lb Wetlabs profiler. This apparatus holds a variety of different instruments. As it is lowered into the water column, it measures salinity, temperature, and optical properties as influenced by the amount of sediment and algae.
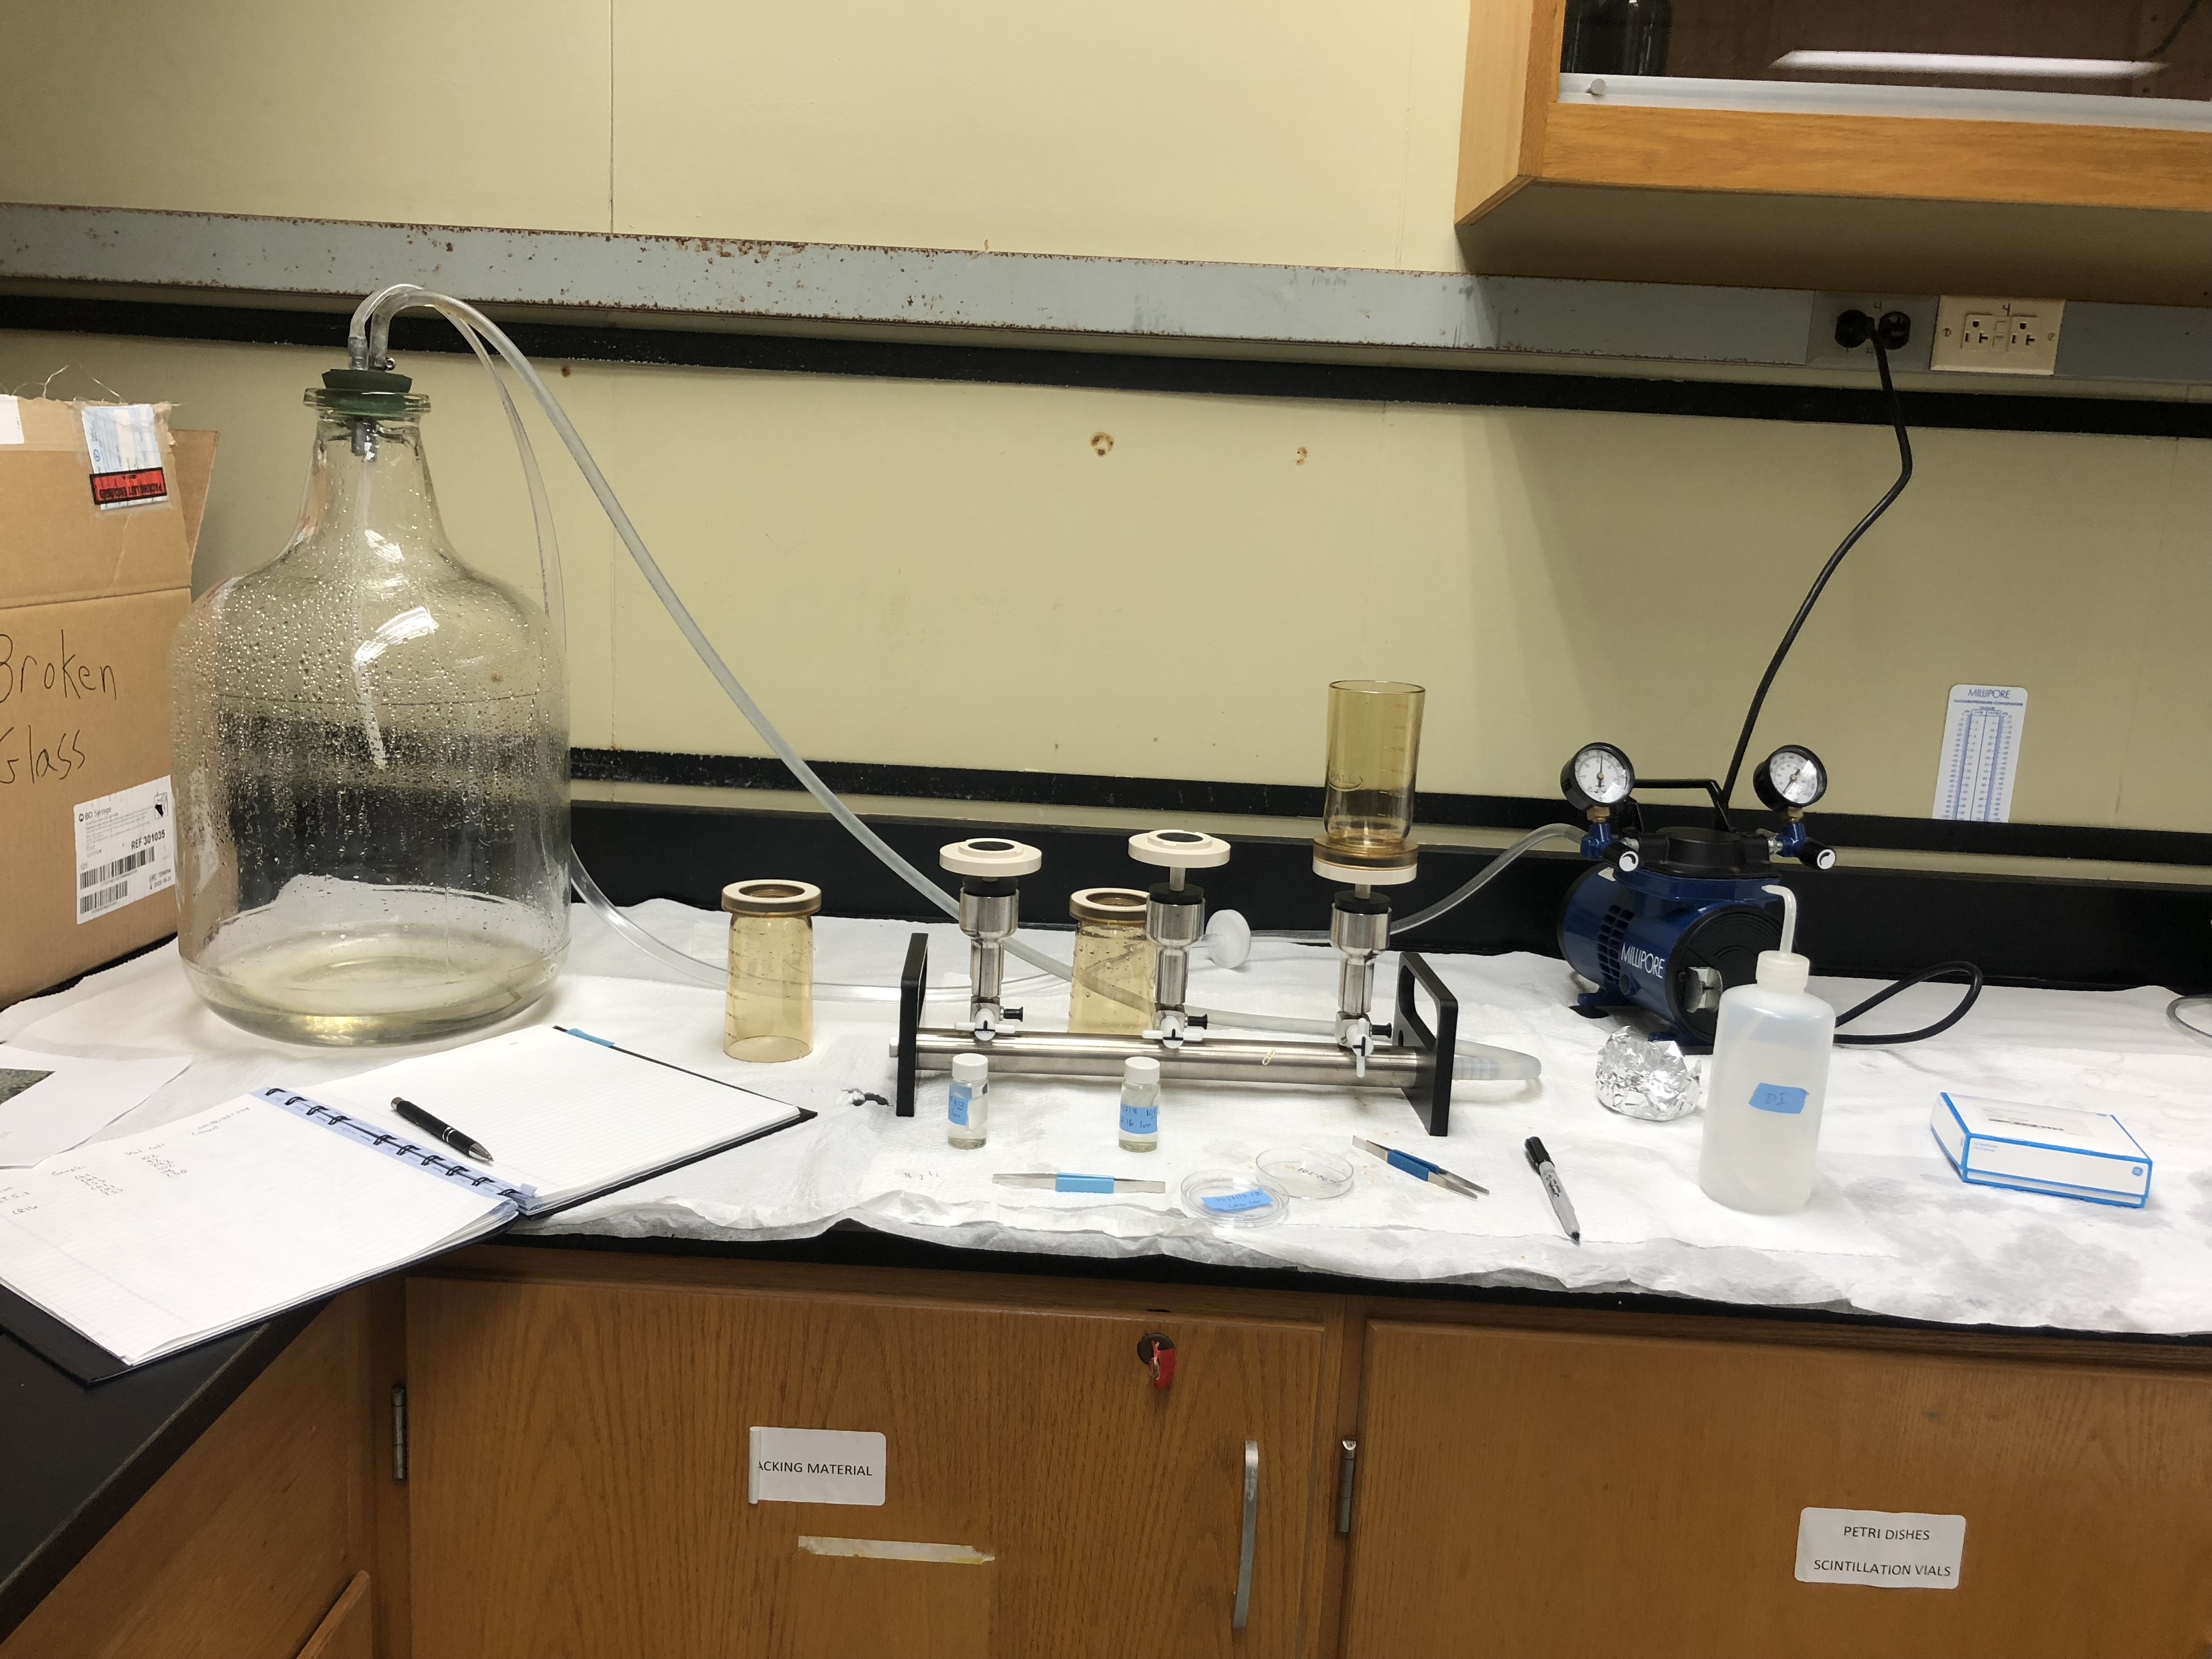
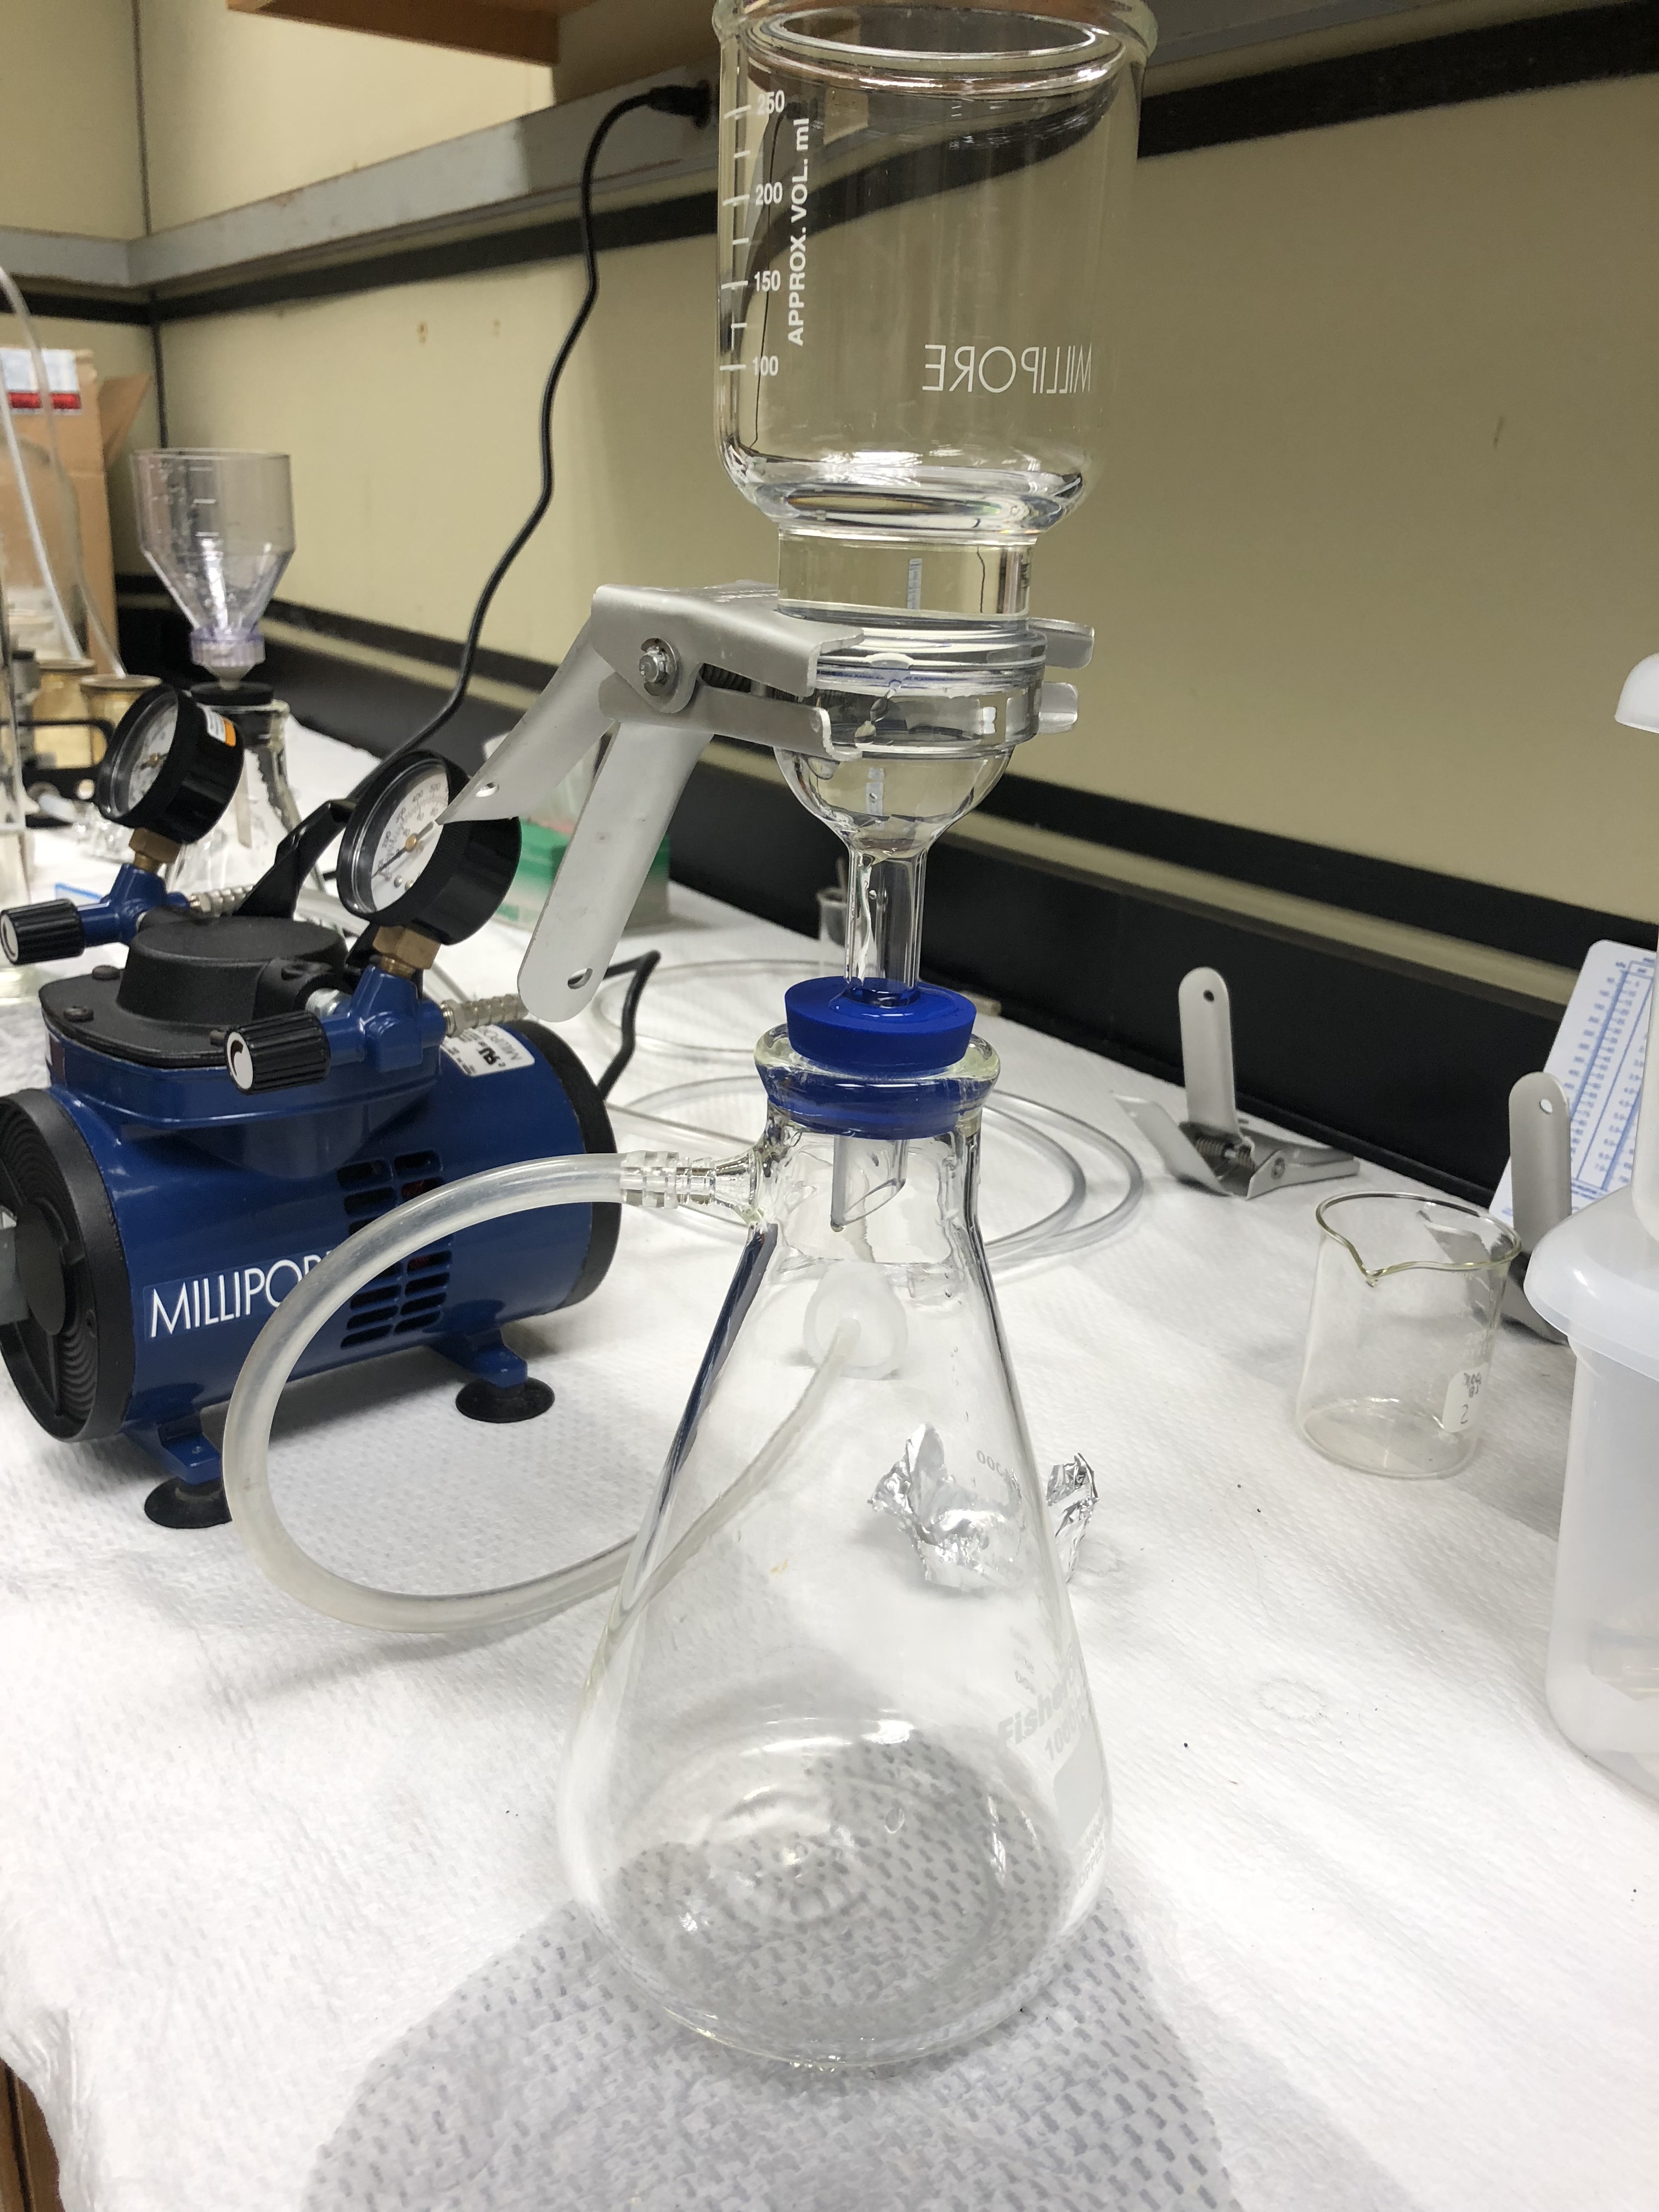
We repeated all these measurements seven more times at the other sites. When we were finally done we travelled back to HPL, unloaded, and started our lab analysis (after a quick bite to eat at ThaiTalian Infusion Cuisine!) Back at the lab, we then filtered our water samples and measured parameters that we couldn’t measure on the boat such as CDOM and pigment concentrations.
All these data will be collated and used to help improve water quality measurements as measured from satellites or drones. All in all it was a long but successful day of data collection. Stay tuned for more blog posts about this research!

[…] before and after chemical depigmentation. I’ve also learned a lot of new field techniques (see first blog post) that I had never done […]
LikeLike